Blog Overview:
Introduction
Parts List and Arduino Wiring
Arduino Code and Battery Charge Tests
Python Code and Datalogging Battery Voltage Output
Conclusion and Continuation
Introduction
Parts List and Arduino Wiring
An Arduino Uno board is used as the main datalogger for the tutorial, which will allow for real-time measurement of voltages and currents as a function of time. The 10-bit ADC of the Arduino is used to measure the voltage outputted by the V25 battery’s USB-C D+ pin, while the INA219 reads the input voltage and current of the power supply. The INA219 is a good choice due to its low quiescent current during power down (~6μA) and minimal consumption during reading (~1mA).
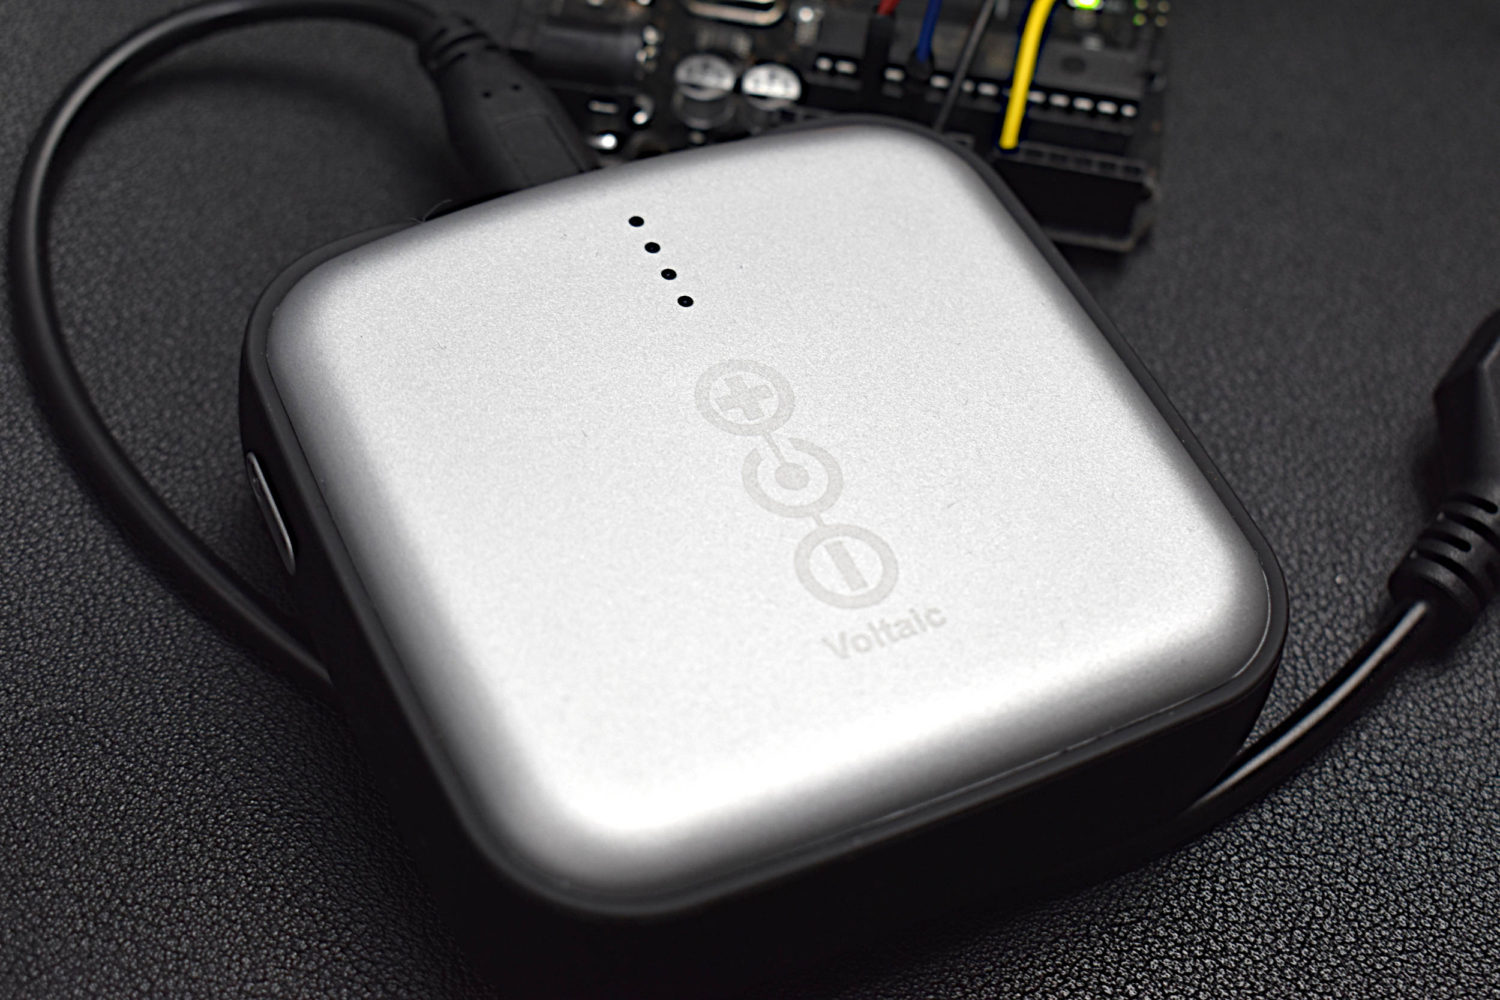
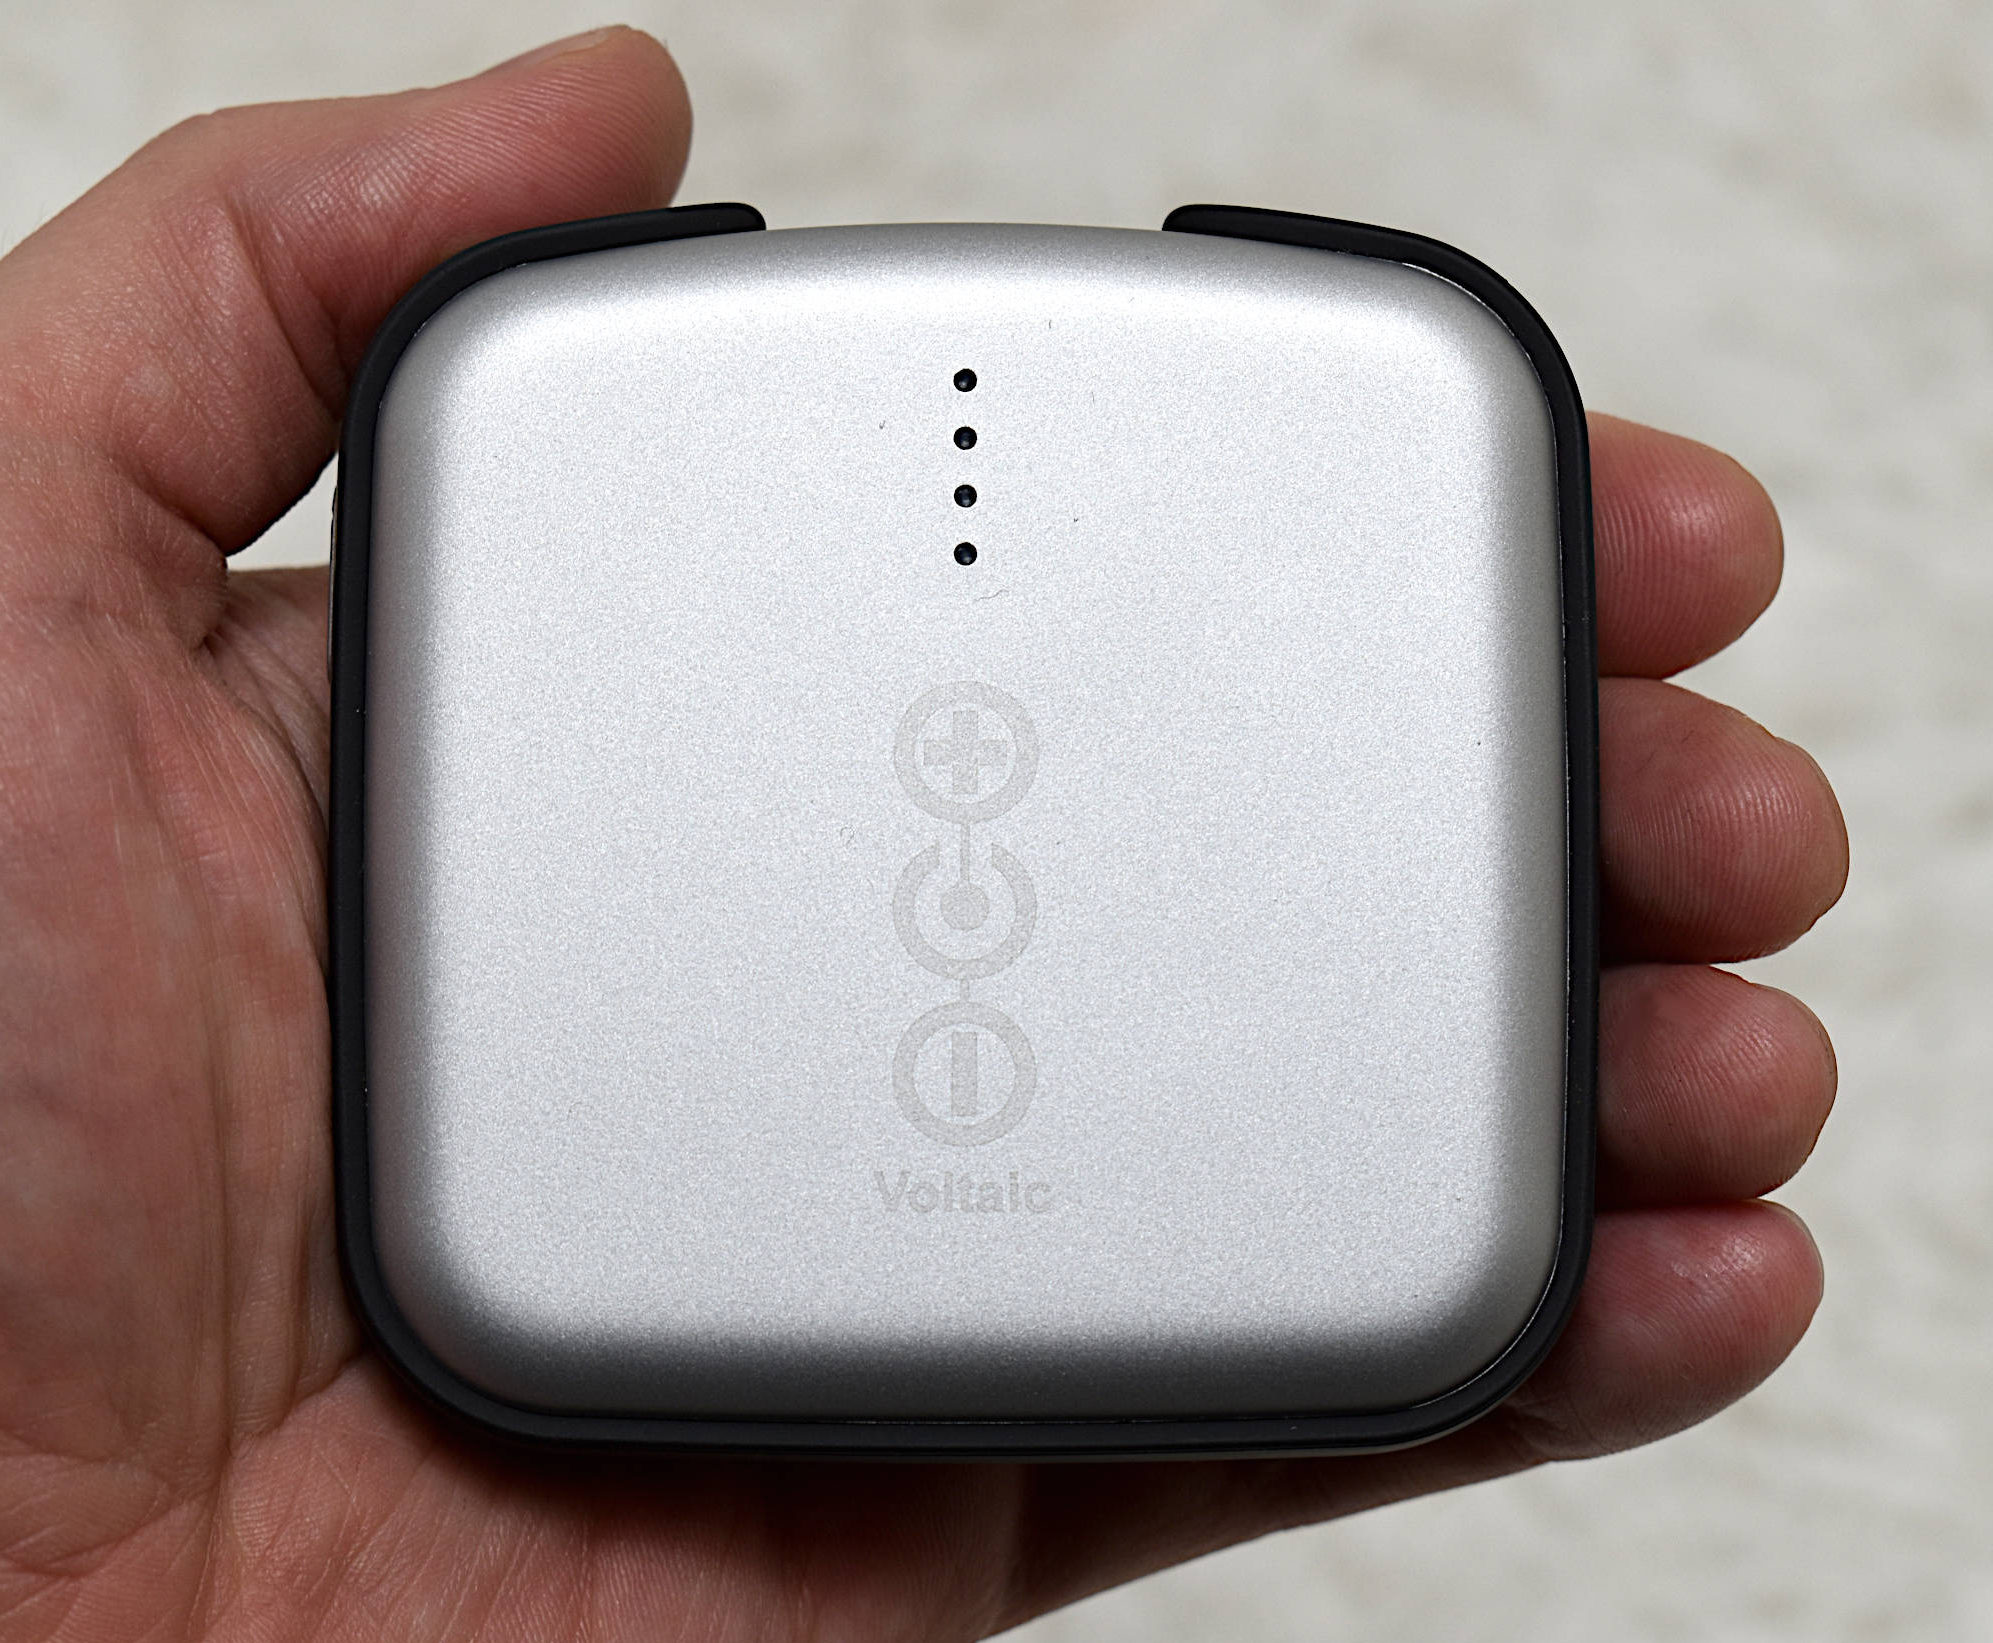
V25 USB Battery Pack
The principal components required to follow along with the experiment are:
- V25 USB Battery Pack – $35 [Buy from Voltaic]
- Arduino Uno Board – $13.00 [Buy from Maker Portal]
- INA219 Current/Voltage Sensor – $7.89 [Buy from Amazon]
- USB-C Terminal Breakout – $8.99 [Buy from Amazon]
- 0V-30V, 5A Variable Power Supply – $69.97 [Buy from Amazon]
- 18 AWG Solid Core Wire – $14.49 [Buy from Amazon]
- Mini Breadboard – $3.00 [Buy from Maker Portal]
The 18 AWG wire is a particularly important requirement for the power supply and load circuit, as many of the standard jumper wires included with Arduino kits are incapable of handling the 2A supply currents requested by the V25 battery pack. Another important caveat of the 18 AWG is that the diameter is too thick for Arduino input pins, so be sure to use 22 AWG for the Arduino components and 18 AWG for the power circuit. Any power supply should work for this particular application, under the assumption that it can supply the 5V/2A specification of the USB-C port of the battery. Keep in mind – if a lower capacity charger is used, longer charge times will result. It is also important to use the terminal portion of the INA219 voltage/current sensor, instead of the inline pins. This will again circumvent any amperage limitations on the traces of the breadboard used to wire the INA219 (if at all).
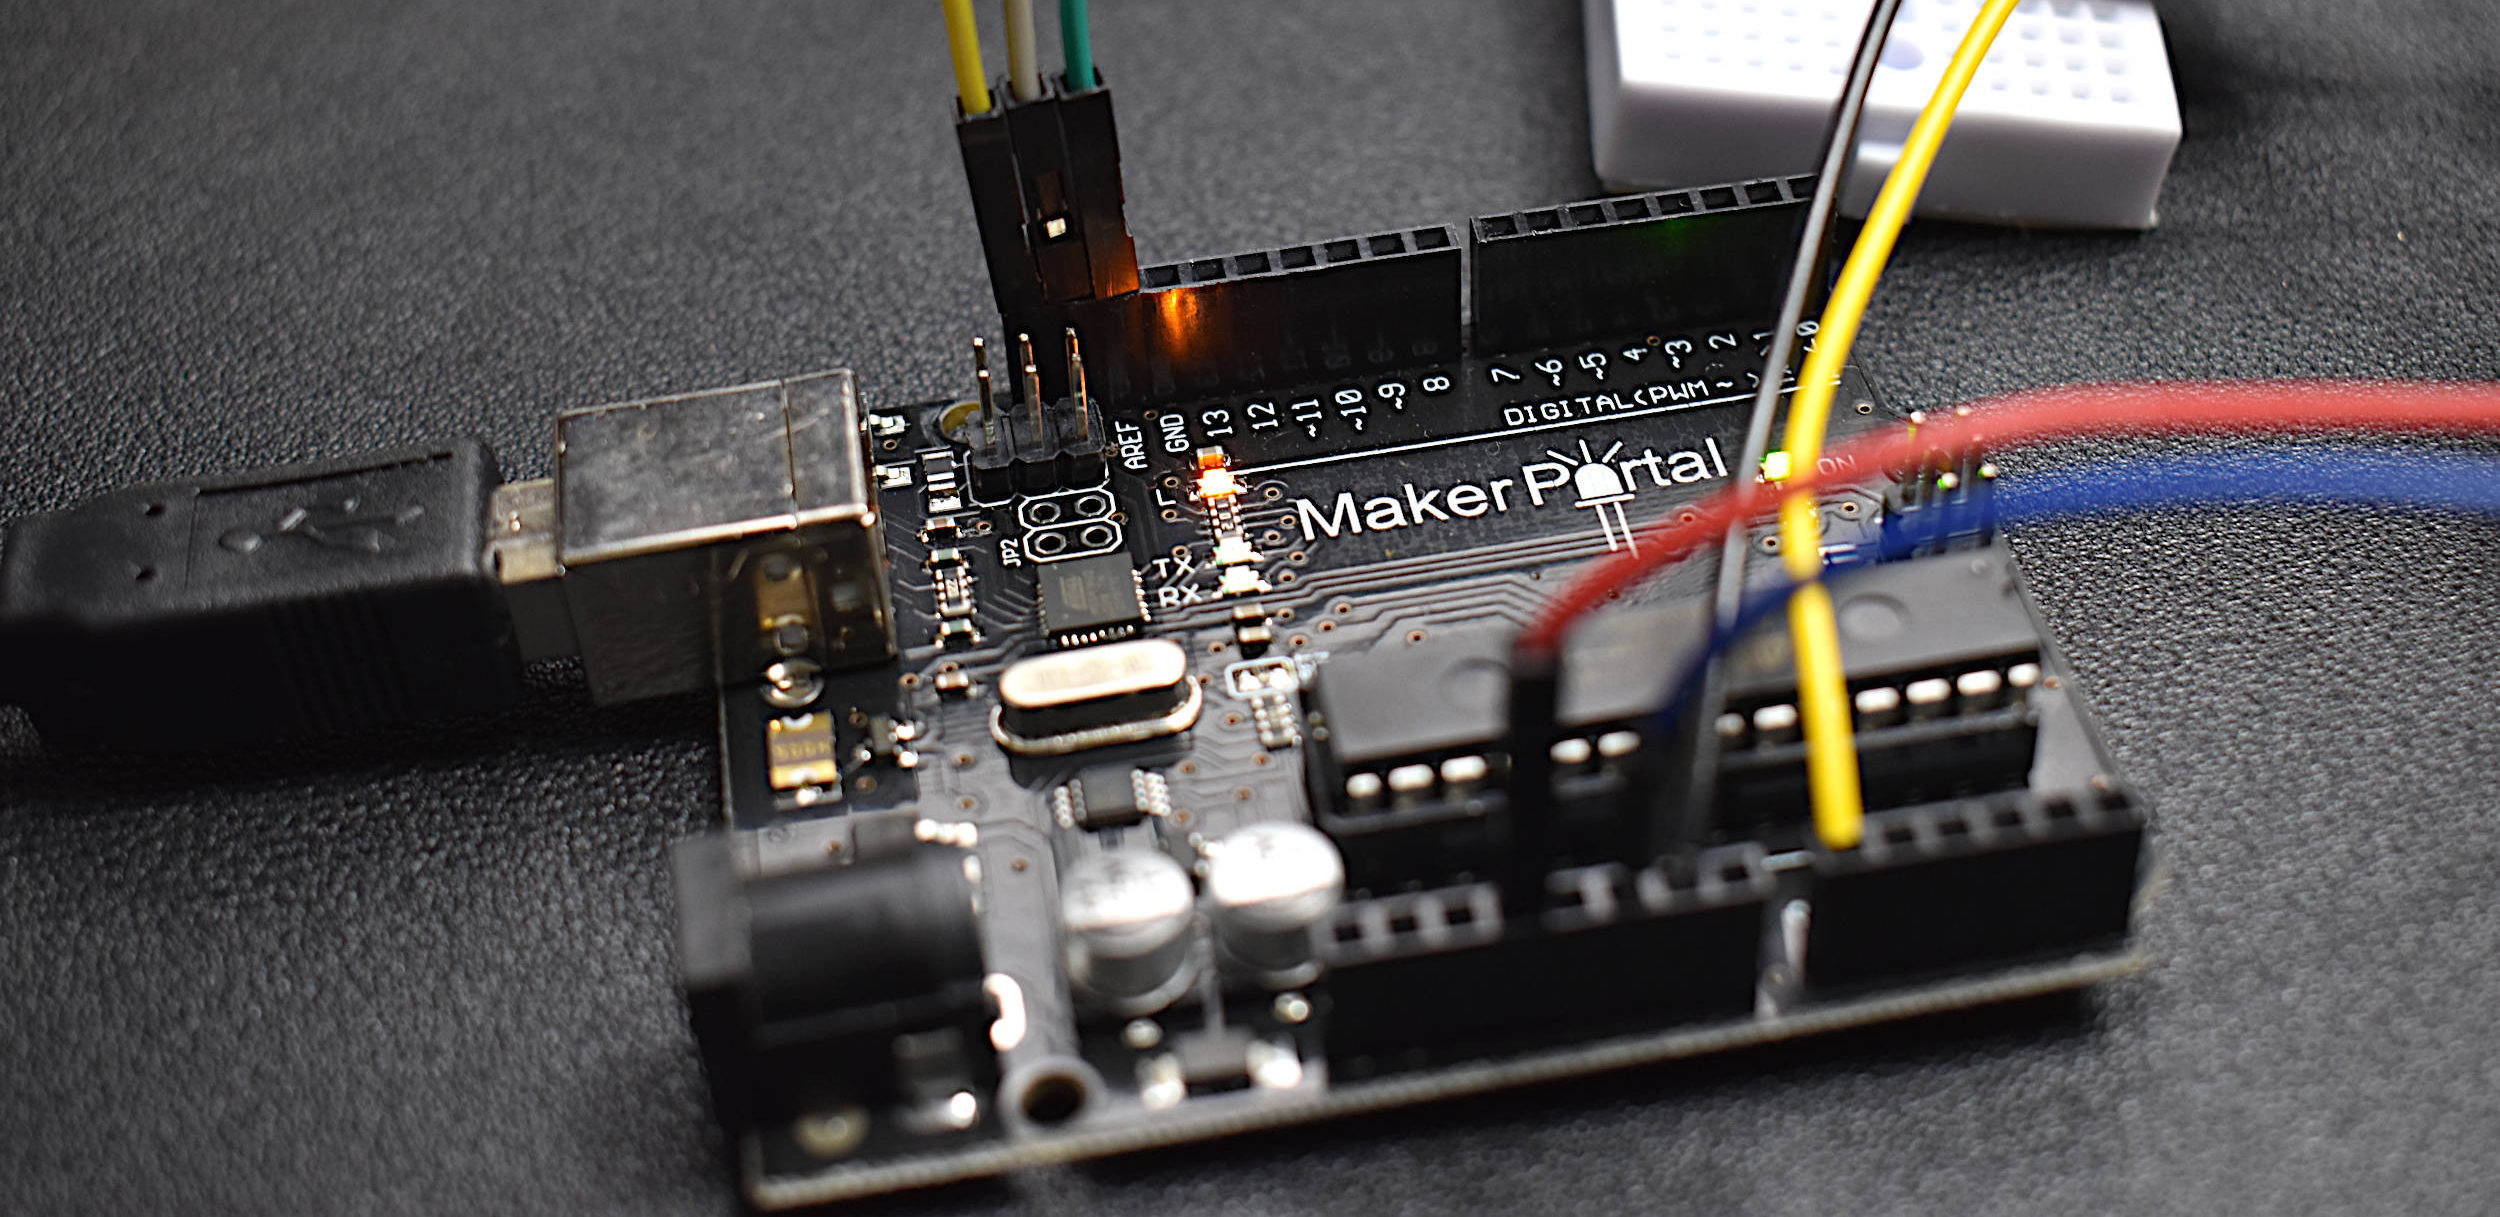
The wiring diagram is given below that links all components used in the tutorial:
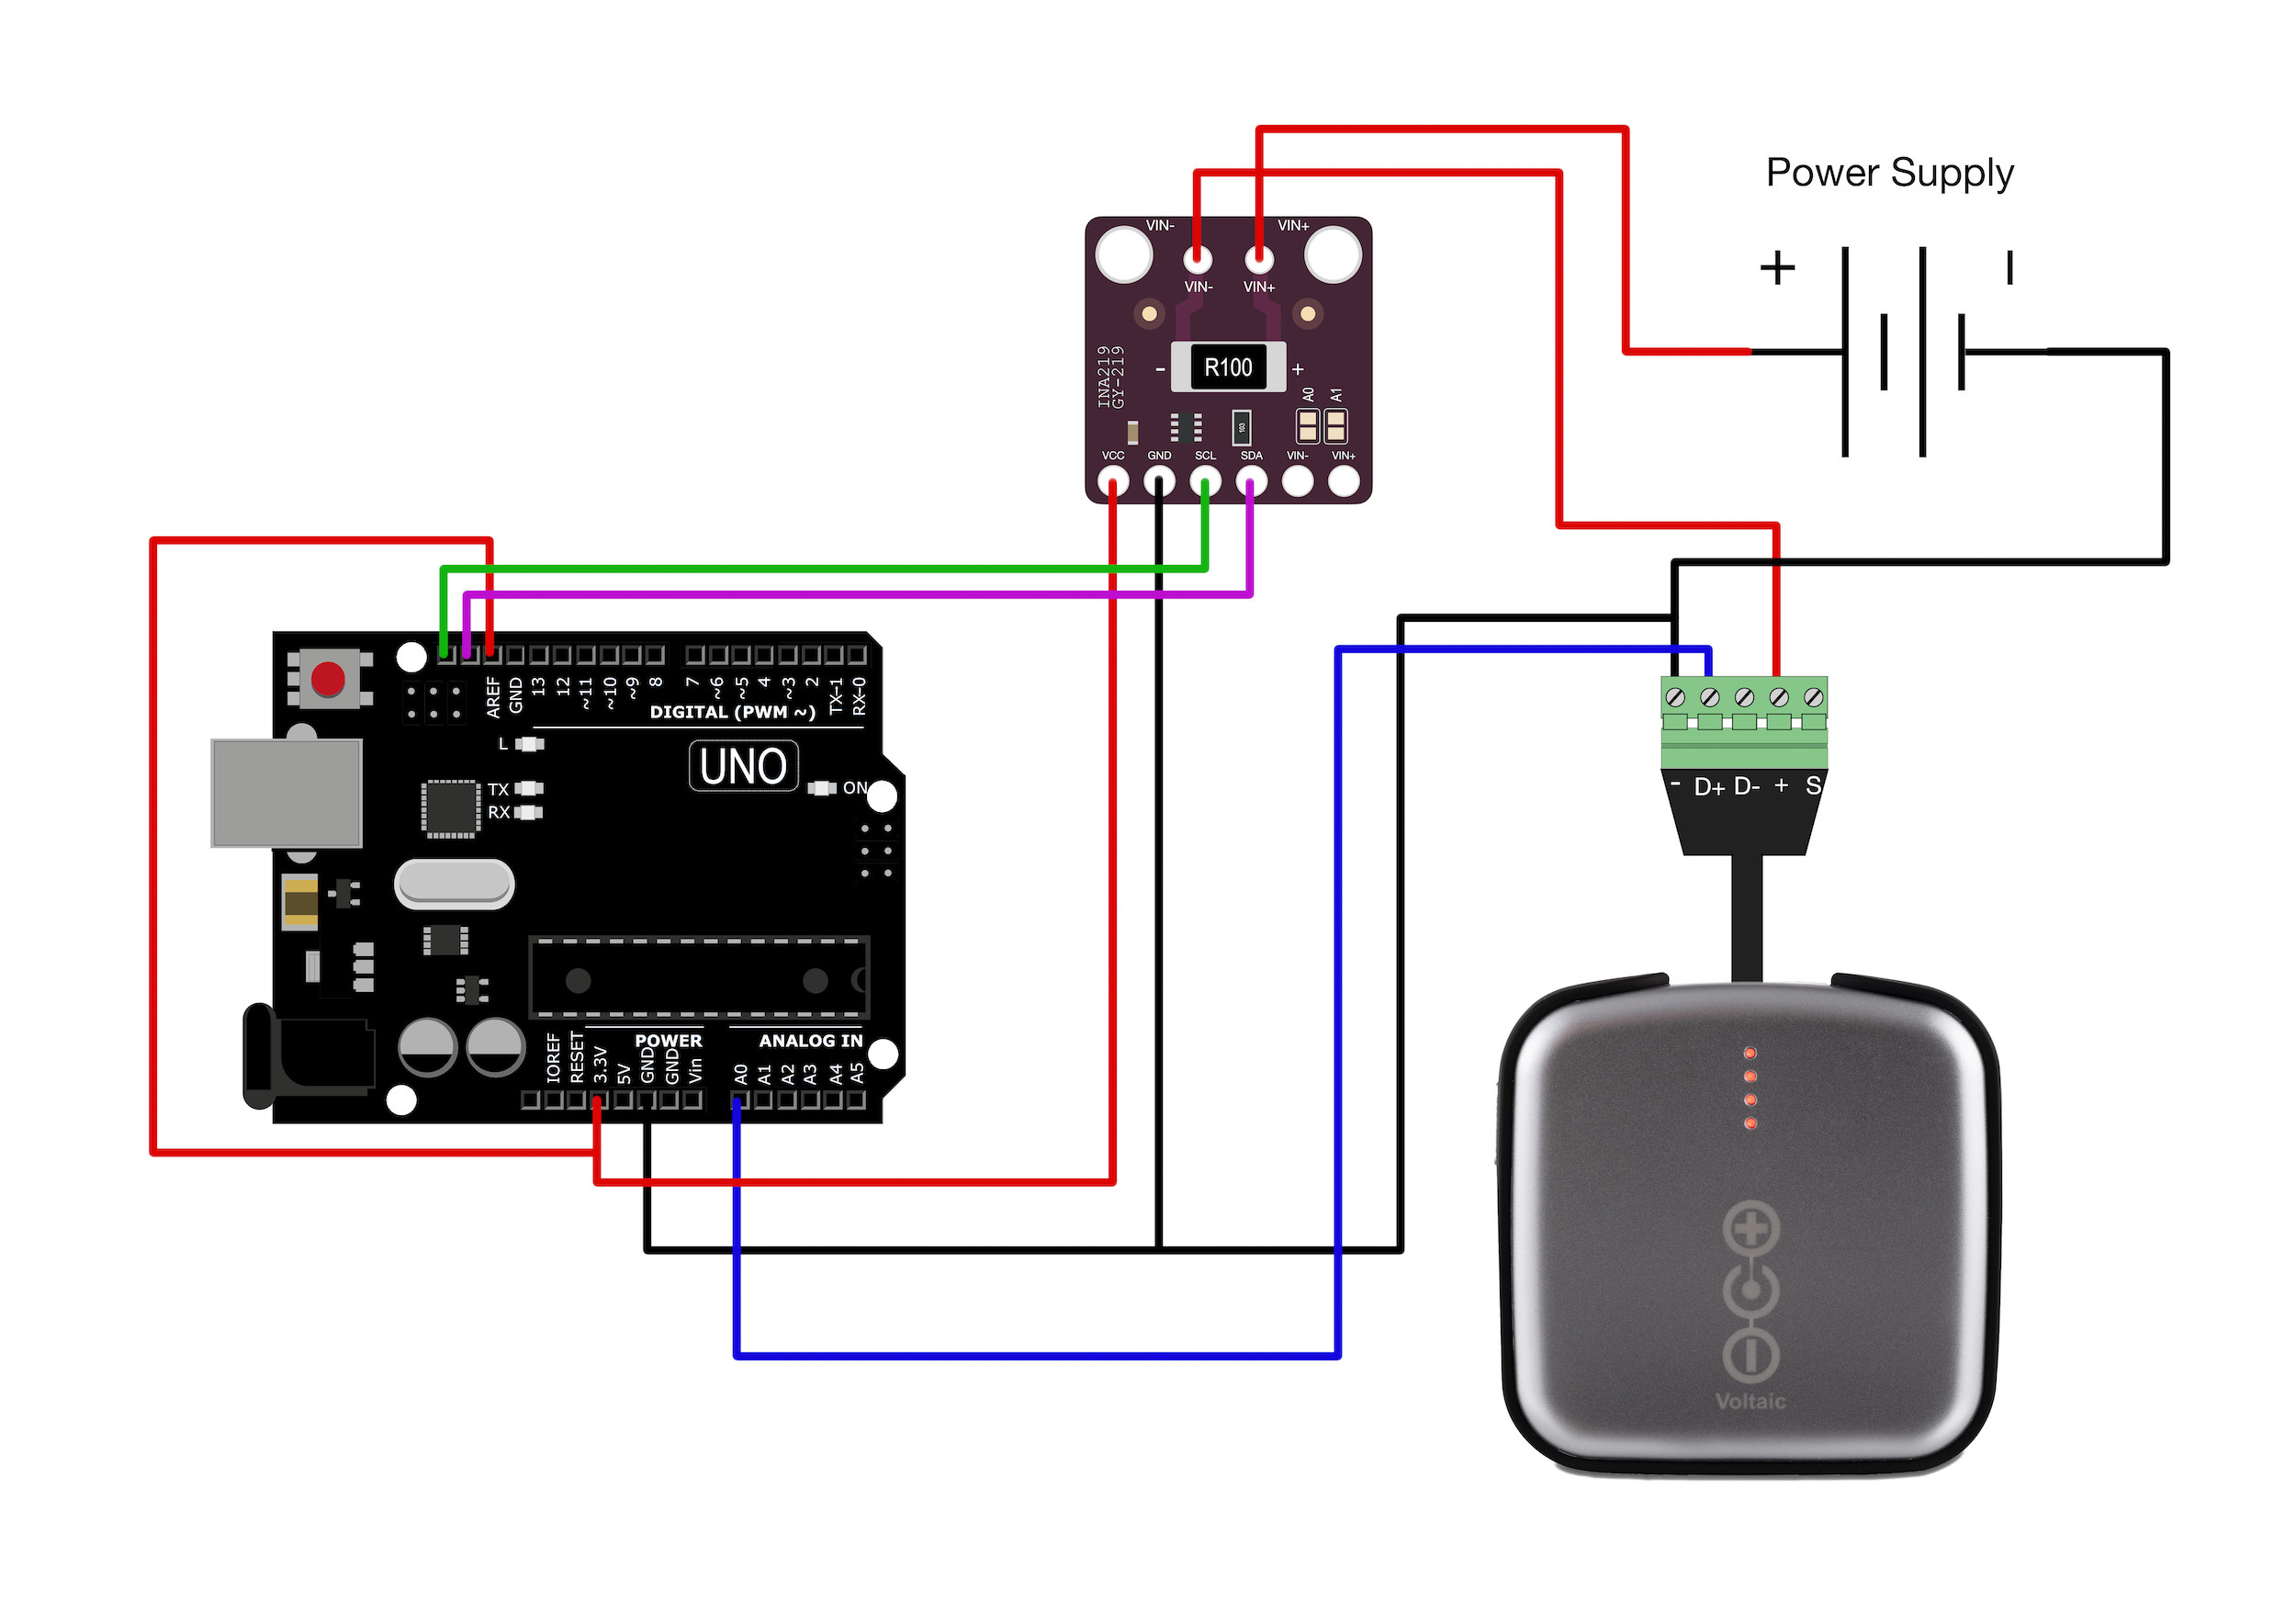
Figure 1: Wiring diagram between Arduino board, V25 battery, INA219 voltage/current sensor, and external power supply
The relationship between a USB-C plug and the USB-C terminal can be seen in the figure below:
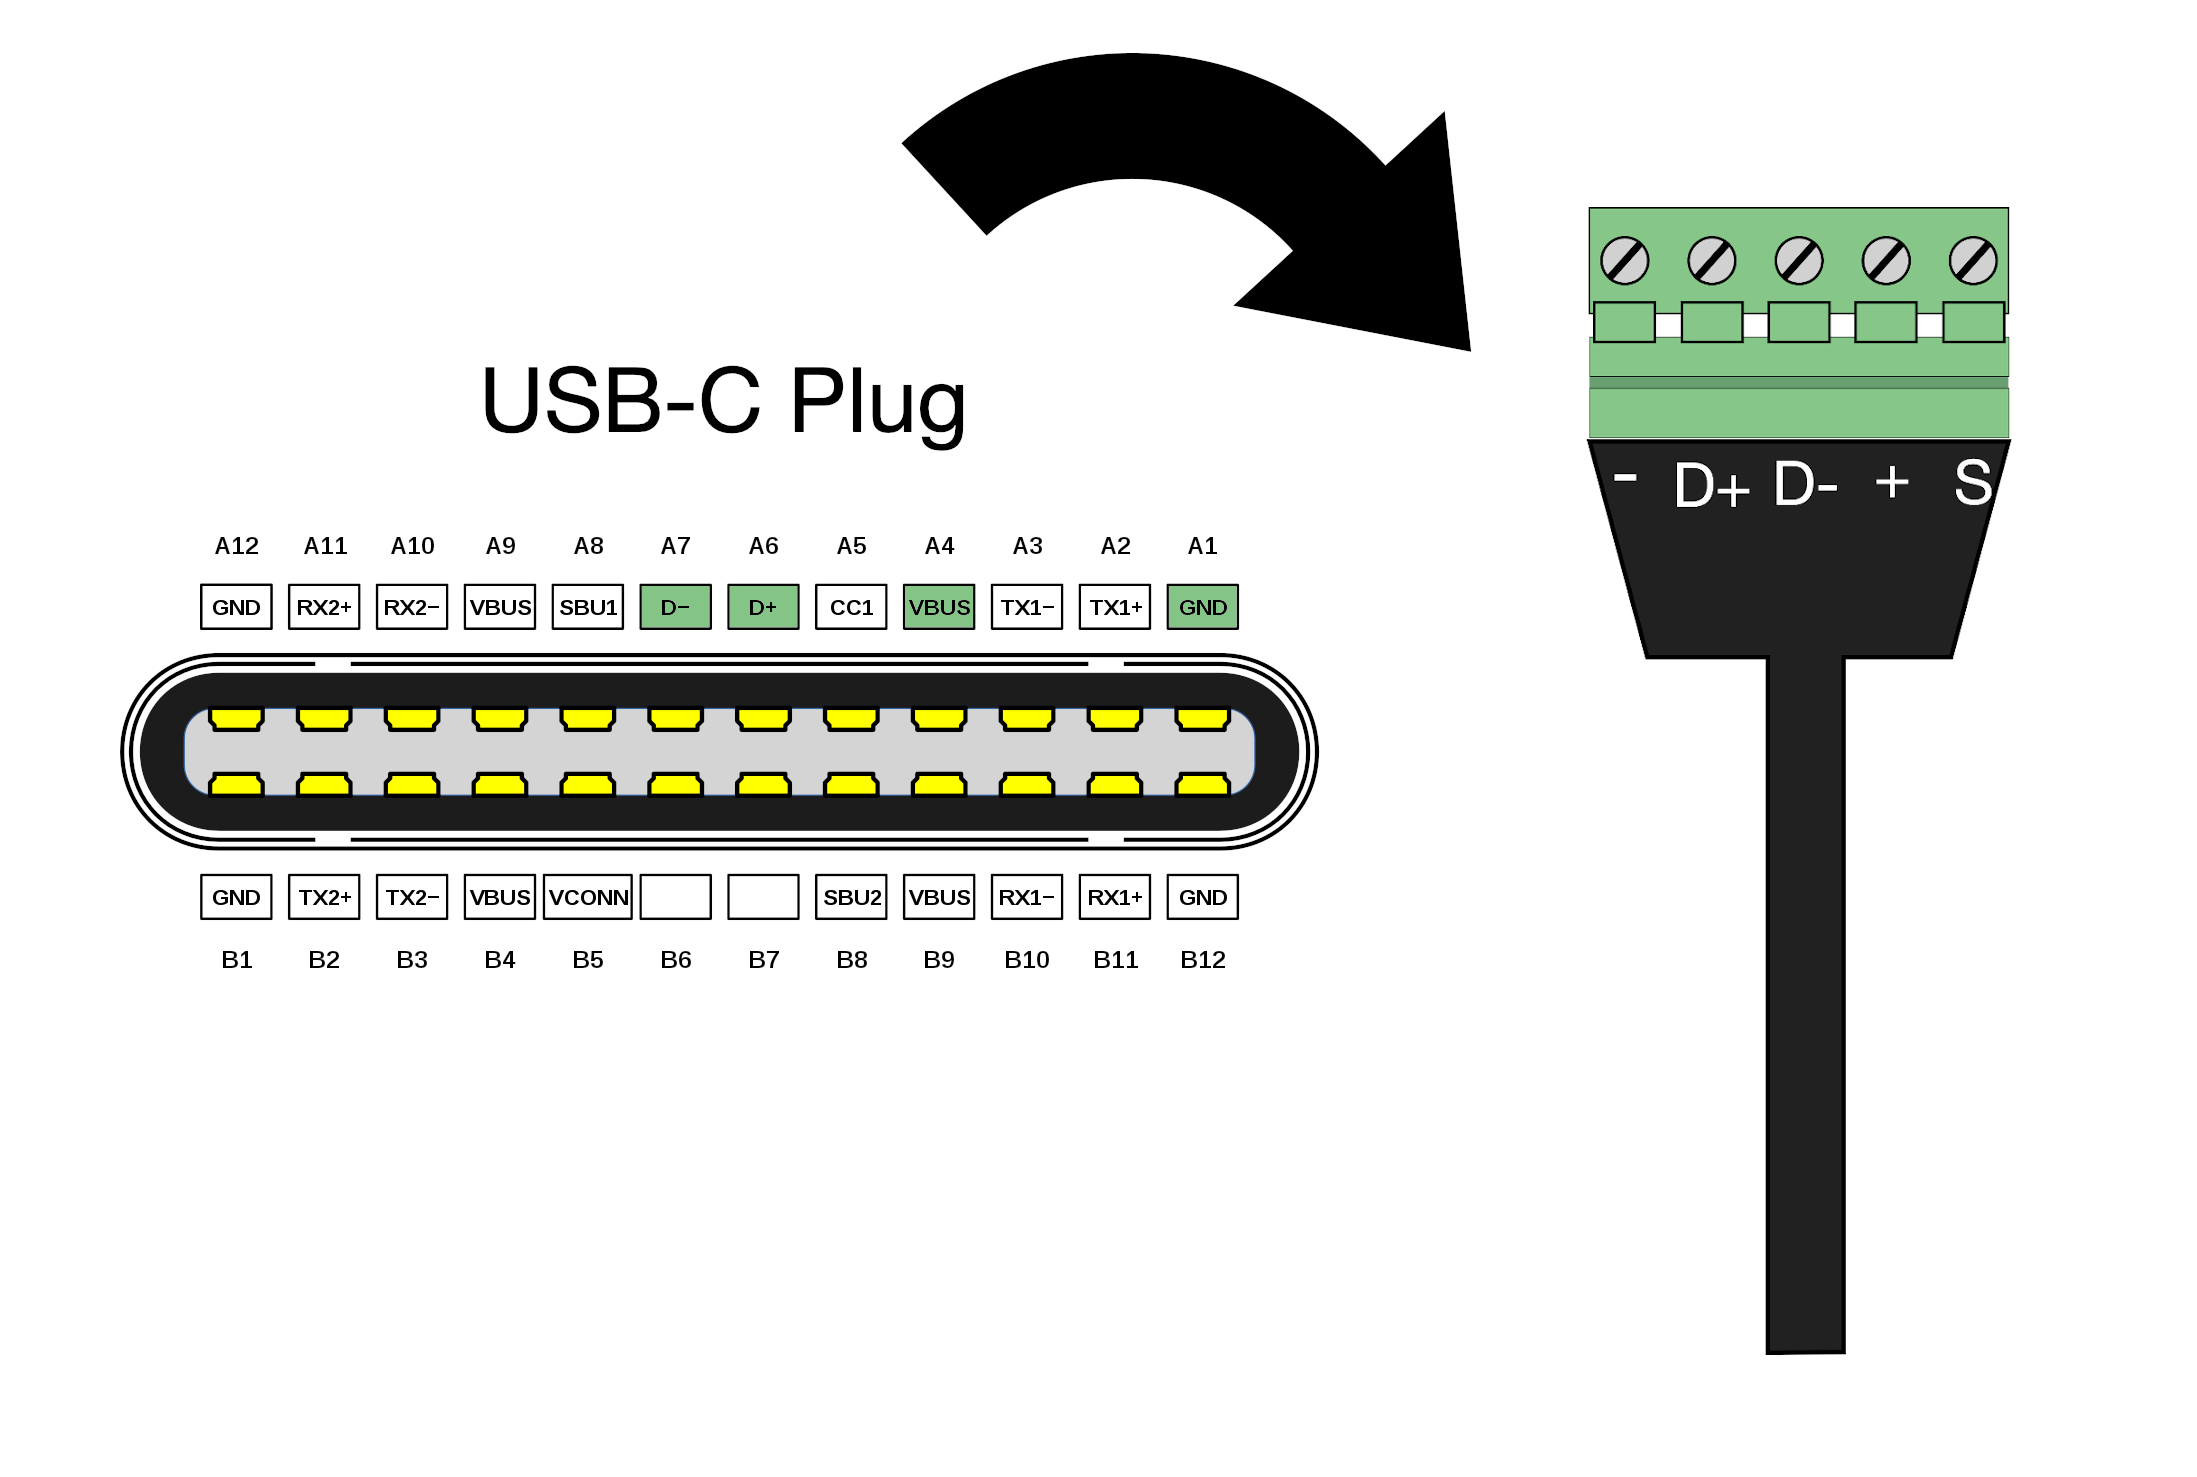
Figure 2: USB-C plug in relation to USB-C terminal pin inputs.
Since the INA219 is a high-side current sensor, we see its function at the beginning of the circuit taking the input directly from the power supply. Then, the V25 battery follows next in the circuit, ultimately leading back to the power supply’s ground. Additionally, the D+ is broken out from the USB-C terminal to go directly to the Arduino board’s A0 analog pin, which is where we will measure the V25 cell voltage. We also need the Arduino to share a ground with the power supply, which is also what’s done in Figure 1. Lastly, the INA219 is wired to the Arduino Uno via the Inter-Integrated Circuit (I2C) protocol. Another important point to note is the use of the 3.3V analog reference. As stated at the introduction, the V25 battery has a scaled voltage of roughly 1/2, which means that we will see a maximum cell voltage around 4.2 – which scales by half to 2.1. Thus, we don’t need the entire 5V analog range of the Arduino, which is why we have chosen 3.3V as the reference. This will give us higher resolution on the 10-bit reading, which consequently is from 0V-3.3V. In the next section, the Arduino code used to measure voltage and current in real-time is introduced and explained.
Arduino Code and Battery Charge Tests
The Arduino code given below measures voltage from the input power supply and load current from the V25 battery, while also reading the USB-C D+ voltage output on pin A0 of the Arduino board. The code was developed using the Arduino IDE version 1.8.13.
/*
 * Reading Voltages and Current with Arduino ADC + INA219
 * -------------------------------------------------------
 *
 * Maker Portal LLC Copyright 2020
 * Written by: Joshua Hrisko
 *
 */
#include <Wire.h>
#include <Adafruit_INA219.h>

Adafruit_INA219 ina219_A(0x40); // start INA219 current/voltage sensor

void setup(void)
{
  analogReference(EXTERNAL); // set analog reference to 3.3V
  Serial.begin(115200); // open serial port at 115200 bps
  Serial.println("Acquisition Start"); // start word for Python code

  // check to make sure INA219 is being read
  if (! ina219_A.begin()) {
    Serial.println("Failed to find First INA219 chip (0x40)");
    while (1) { delay(10); }
  }
  // print header for logging data:
  Serial.println("Time[s],InputVoltage[V],InputCurrent[mA],D+[V]");
}

void loop(void)
{
  // preallocate variables
  float shuntvoltage = 0.0; float busvoltage = 0.0;
  float current_mA = 0.0; float loadvoltage = 0.0;
  float d_plus = 0.0;

  // read variables from INA219 (voltages/current)
  shuntvoltage = ina219_A.getShuntVoltage_mV();
  busvoltage = ina219_A.getBusVoltage_V();
  current_mA = ina219_A.getCurrent_mA(); // load current
  loadvoltage = busvoltage + (shuntvoltage / 1000); // load voltage
  d_plus = 3.3*analogRead(A0)/1023.0; // reading D+ from USB-C on Arduino pin A0

  Serial.print(millis()/1000.0); // print milliseconds since code start
  Serial.print(","); // comma-separation
  Serial.print(loadvoltage); // load voltage
  Serial.print(",");
  Serial.print(current_mA); // load current
  Serial.print(",");
  Serial.println(d_plus); // D+ scaled cell voltage
  delay(1000); // wait 1 second between readings
}
The code outputs four variables: seconds since the start of the Arduino program, voltage passing through the load, current passing through the load, and scaled voltage outputted by the USB-C D+ pin. These four variables will help us determine what is happening with the system over time during charging. Below is an example output from the Arduino’s serial port upon correct wiring according to Figure 1 and uploading of the code above:
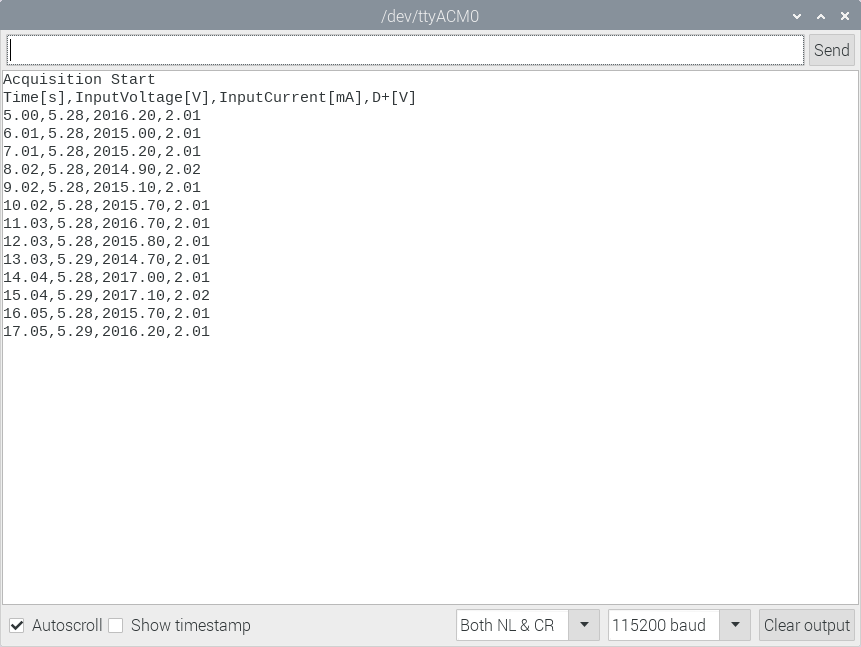
Figure 3: Arduino INA219 serial output example showing the time, load voltage, load current, and USB-C scaled voltage output.
Investigation of Figure 3 tells us that we have an input voltage of roughly 5V (~5.3V in my case), a load amperage of 2A, and a scaled voltage of 2.01V. Similar values should give confidence that the user has wired the components correctly, uploaded the code properly, and is following along closely with the expectations of the experiment. In the next section, a Python code will be presented that reads the serial outputs shown above and plots them in real time. Later in the code, the outputs will be saved for analysis and post processing.
Python Code and Datalogging Battery Voltage Output
At this stage in the experiment, the user should have a constant stream of voltage and current values being outputted by the Arduino board. In this section, a Python script will be used to read the Arduino serial data and plot the values in real time. Python 3.7 is used, in conjunction with a series of libraries and protocols for reading from the Arduino serial port. The Python code for reading and plotting in real time is given below:
##################################################
# ---- Python Serial Port Datalogger
#
# ---- Maker Portal LLC Copyright 2020
# ---- Written by: Joshua Hrisko
#
##################################################
#
# This code reads from the serial port and saves
# the data until the user presses
# CTRL+C, wherein the acquisition ceases
#
##################################################
#
import numpy as np
import matplotlib.pyplot as plt
import serial,datetime,csv,os
import serial.tools.list_ports as COMs
#
#
############################################
# Real-time plotter functions
############################################
#
def plotter_start(x_lims=[0.0,1.0],new_plot=1):
if new_plot:
plt.style.use('ggplot')
fig = plt.figure(figsize=(12,9))
ax = fig.add_subplot(111)
ax2 = ax.twinx()
ax.set_xlim(x_lims)
ax.set_ylim([0.0,6.0])
ax2.set_ylim([0.0,2200.0])
ax.set_ylabel('Voltage [V]')
ax2.set_ylabel('Current [mA]')
ax.set_xlabel('Time [s]')
lines = []
for ii,header_ii in enumerate(header[1:]):
if ii==1:
line_ii, = ax2.plot([],color=plt.cm.Set1(ii),linewidth=3.0,
label=header_ii)
else:
line_ii, = ax.plot([],color=plt.cm.Set1(ii),linewidth=3.0,
label=header_ii)
lines.append(line_ii)
ax.legend(loc='upper left')
ax2.legend(loc='upper right')
fig.canvas.draw()
ax_background = fig.canvas.copy_from_bbox(ax.bbox)
plt.show(block=False)
else:
fig = plt.gcf()
for ii in fig.get_axes():
ii.cla()
fig.clf()
ax = fig.add_subplot(111)
ax2 = ax.twinx()
ax.set_xlim(x_lims)
ax.set_ylim([0.0,6.0])
ax2.set_ylim([0.0,2200.0])
ax.set_ylabel('Voltage [V]')
ax2.set_ylabel('Current [mA]')
ax.set_xlabel('Time [s]')
lines = []
for ii,header_ii in enumerate(header[1:]):
if ii==1:
line_ii, = ax2.plot([],color=plt.cm.Set1(ii),linewidth=3.0,
label=header_ii)
else:
line_ii, = ax.plot([],color=plt.cm.Set1(ii),linewidth=3.0,
label=header_ii)
lines.append(line_ii)
ax.legend(loc='upper left')
ax2.legend(loc='upper right')
fig.canvas.draw()
ax_background = fig.canvas.copy_from_bbox(ax.bbox)
return fig,ax,ax2,lines,ax_background
def plotter_update(xs,y_vec):
y_vec = np.transpose(y_vec)
for iter_ii in range(0,len(lines)):
if iter_ii==1:
lines[iter_ii].set_data(xs,y_vec[iter_ii])
ax2.draw_artist(lines[iter_ii])
else:
lines[iter_ii].set_data(xs,y_vec[iter_ii])
ax.draw_artist(lines[iter_ii])
fig.canvas.restore_region(ax_background)
fig.canvas.blit(ax.bbox)
fig.canvas.draw()
return
#
############################################
# Find Arudino ports, select one,
# start communication with it
############################################
#
arduino_ports = [ii.device for ii in COMs.comports() if\
len((ii.device).split('ttyACM'))>1 or\
len((ii.device.split('ttyUSB')))>1]
ser = serial.Serial(arduino_ports[0],baudrate=115200) # match baud on Arduino
ser.flush() # clear the port
#
############################################
# Grabbing real-time data from Arduino
############################################
#
t_now = datetime.datetime.strftime(datetime.datetime.now(),
'%Y_%m_%d_%H_%M_%S')
datafile = 'arduino_data_'+'{0}'.format(t_now)+'.csv' # date
t_vec = [] # allocate time vector
data_array,data_plot = [],[] # for saving all values
start_bool = False
plot_refresh_dt = 60 # every # of seconds between axes limit updates
plot_update_pts = 10 # number of pts to read before plotting
#
while True:
try:
ser_bytes = ser.readline() # read Arduino serial data
decoded_bytes = ser_bytes.decode('utf-8') # decode data to utf-8
data = (decoded_bytes.replace('\r','')).replace('\n','')
if start_bool==False and data=='Acquisition Start':
# read the first line after acquisition start as header
header = (((ser.readline()).decode('utf-8').replace('\r','')).\
replace('\n','')).split(',')
# create csv file for saving the data each loop
with open(datafile,'w') as csvfile:
csv_writer = csv.writer(csvfile,delimiter=',')
csv_writer.writerow([header])
fig,ax,ax2,lines,ax_background = plotter_start(x_lims=[0.0,
plot_refresh_dt],new_plot=1) # start plot
start_bool = True
print('Data Acquisition Starting...')
ser.flush()
continue
if start_bool:
try:
if len([float(ii) for ii in data.split(',')[1:]])!=3:
continue
t_vec.append(float(data.split(',')[0]))
data_plot.append([float(ii) for ii in data.split(',')[1:]])
data_array.append([float(ii) for ii in data.split(',')])
except:
continue # if data format issue - skip
if len(t_vec)%plot_update_pts==0:
plotter_update(t_vec,data_plot) # update data on plot
# set new limits on plot to create scrolling effect
if ax.get_xlim()[1]<t_vec[-1]:
new_xlims = [0.0,plot_refresh_dt+t_vec[-1]]
fig,ax,ax2,lines,ax_background = plotter_start(new_xlims,0)
plotter_update(t_vec,data_plot) # update data on plot
# save data to the existing csv file
with open(datafile,'a',newline='',encoding='utf-8') as csvfile:
csv_writer = csv.writer(csvfile,delimiter=',')
csv_writer.writerow(data_array[-1])
except KeyboardInterrupt:
ser.close() # close the serial port
print('Exiting Loop')
break # finally, exit loop after save
If we first ensure that the battery is fully discharged (this can be done rapidly by using a high current-draw source), we can observe the battery’s behavior as it goes from fully discharged to fully charged. We expect to see several stages of the charge curve: a startup stage involving a rapid change in cell voltage, a constant current stage where the current is steady and the cell voltage is slowly changing, and finally a constant voltage stage where the cell voltage reaches an asymptote and the current decreases [read more about charge curves here]. Typically, the maximum cell voltage is set to 4.2V, which is what we use as the predictor for the maximum voltage in the case of the V25 battery.
The experimental procedure for logging battery voltage is quite simple:
- Ensure the Arduino, INA219, and V25 Battery Pack are wired correctly
- Start the Python data acquisition script
- Set the input voltage to 5V (±5% for DC wall plug supplies)
- Set the input current to 2A (or ensure the wall plug can maintain this)
- Wait for the current to reach approximately 0mA on the Python plot
- Look for the file stored locally with the voltage/current experiment data
Another Python script is included below for data analysis and visualization purposes:
##################################################
# ---- Python Data Plotter (for: Arduino+INA219)
#
# ---- Maker Portal LLC Copyright 2020
# ---- Written by: Joshua Hrisko
#
##################################################
#
# This code reads from locally saved .csv files
# that have Arduino + INA219 values saved by
# the Python script: INA219_pylogger.py
#
##################################################
#
import numpy as np
import matplotlib.pyplot as plt
import csv,datetime
#
################################################
# Data File Reader
################################################
#
#
csv_filename ='./arduino_data_2020_10_31_13_52_15.csv'
data = [] # data vector for storing values
with open(csv_filename,'r') as csvfile:
reader = csv.reader(csvfile,delimiter=',')
header = next(reader)[0].split(',') # header info
for row in reader:
data.append([float(ii) for ii in row]) # append data into array
data = np.array(data) # put into numpy array
# scale voltage based on 4.2V peak:
data[:,3] = (4.2/np.nanmax(data[:,3]))*data[:,3]
start_indx = 0 # start index
end_hour = 6 # hour when charging stops
end_indx = int(end_hour*(3600.0)) # end index
data = data[start_indx:end_indx,:] # clip data
#
################################################
# Plot Routine
################################################
#
plt.style.use('ggplot') # visual formatting
fig = plt.figure(figsize=(14,9)) # open figure
ax = fig.add_subplot(111) # add subplot
t_vec = data[:,0] # time vector
t_diffs = np.append(0.0,np.diff(t_vec)) # finding spikes
t_vec/=(3600.0)
lines,lines_leg = [],[]
for ii in range(1,np.shape(data)[1]):
plot_data = data[:,ii] # variable (currrent, voltage, etc.)
y_diffs = np.abs(np.append(0.0,np.diff(plot_data))) # de-spike
if ii==2: # place current to other side of x-axis
current_label_color = plt.cm.Set1(0)
ax2 = ax.twinx() # move current to other side of axis
ax2.plot(t_vec,plot_data,label=header[ii],
color=current_label_color,linewidth=3.5) # current plot
ax2.set_ylabel('Current [mA]',fontsize=16,color=current_label_color)
ax2.tick_params(axis='y',colors=current_label_color)
ax2.spines['right'].set_color(current_label_color)
ax2.grid(False)
else:
current_label_color=plt.cm.Set1(ii)
ax.plot(t_vec,plot_data,label=header[ii],
color=current_label_color,linewidth=3.5) # voltages
lines.append(plt.Line2D([0],[0],color=current_label_color,
label=header[ii]))
ax.legend(handles=lines,bbox_to_anchor=(0.7,0.5,0.25,0.25),
fontsize=14) # plot legends
ax.set_ylim([2.5,6.0]) # set voltage axis bounds
ax2.set_ylim([0.0,2200.0]) # set current axis bounds
ax.set_xlabel('Time [hours]',fontsize=16)
ax.set_ylabel('Voltage [V]',fontsize=16)
fig.savefig('V25_charge_cycle_readouts.png',dpi=300,bbox_inches='tight')
plt.show()
The script above will create a visualization of the charge curve for the V25 battery. We should see several of the stages expected: startup, constant-current (CC), constant-voltage (CV). If these are not visible on your curve after several hours – there is likely either a wiring issue, Arduino code issue, or Python code issue. Look for errors in wiring if the current are very low or voltages are very low. It is also possible that the charger being used is insufficient. It is best to use a supply to get accurate and steady input.
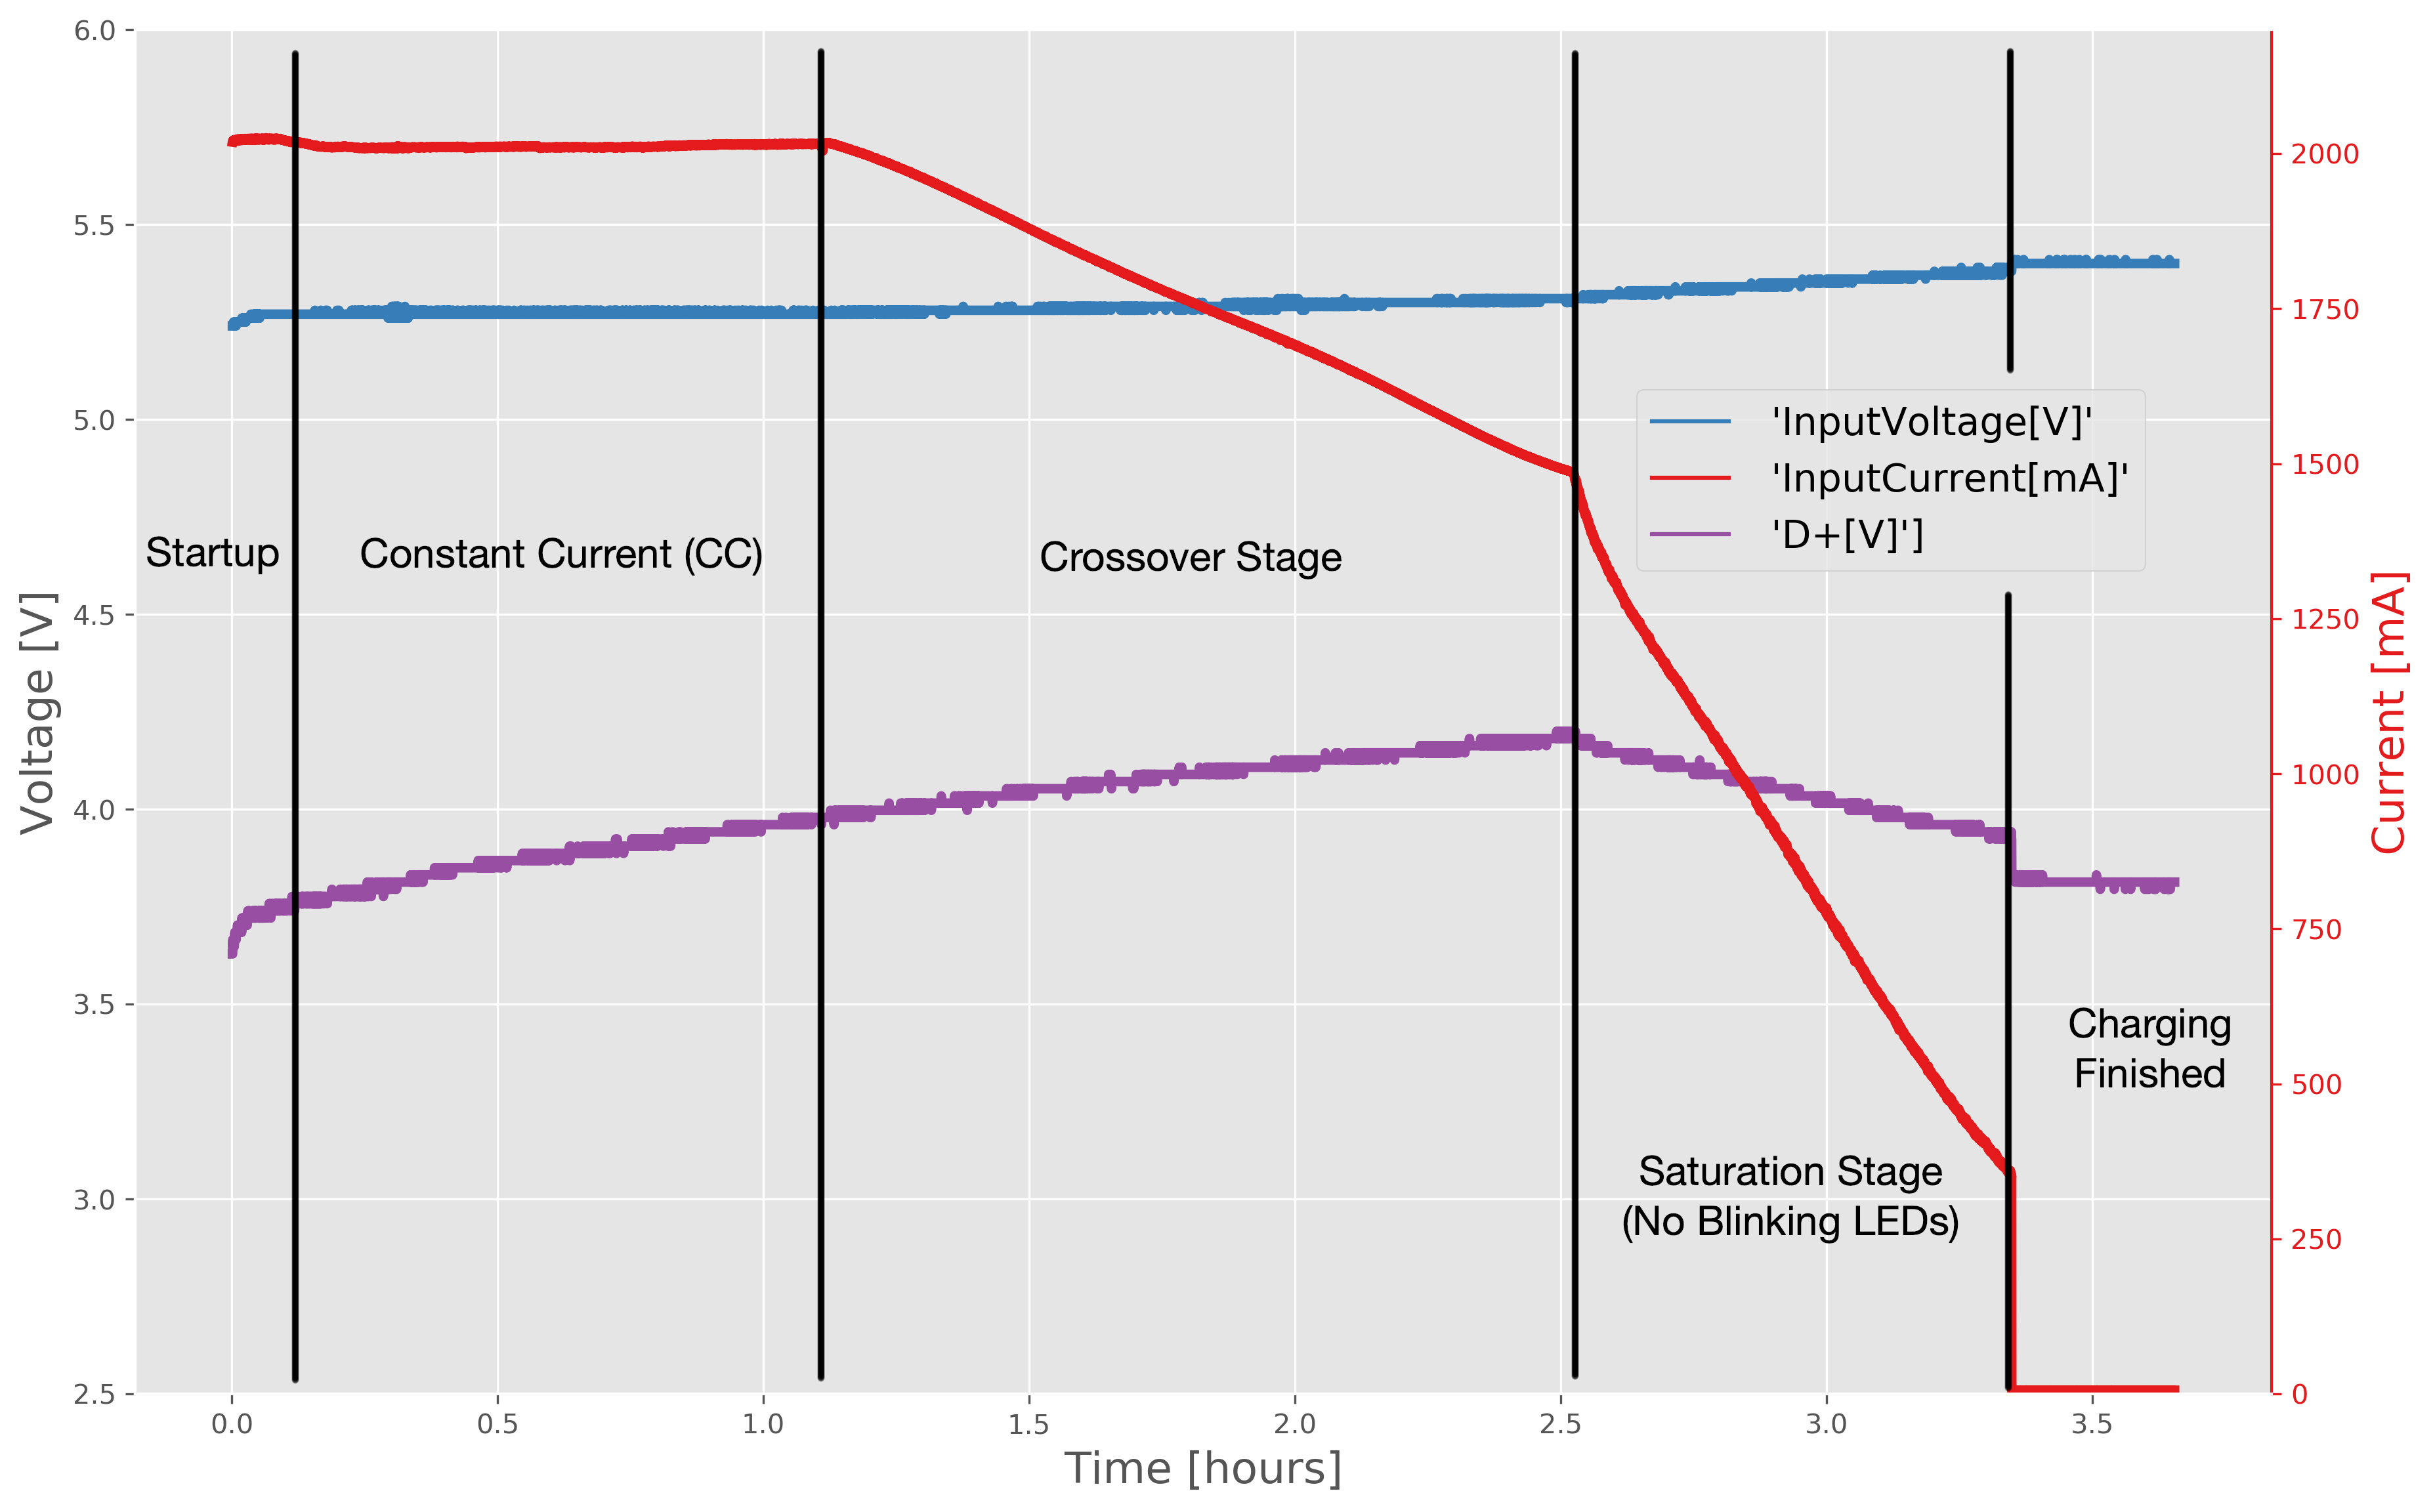
Figure 4: V25 charge cycle results showing the different stages of charge. The cell voltage (purple) has been approximated using a scale factor of 1.84.
The results from our charging experiment are shown above in Figure 4 , where we see five stages of charging. We see the startup stage where the D+ voltage output ramps up, then we see stage two with the long constant-current (CC) spanning just over one hour; finally, we see a crossover stage where the current begins dropping off. The LEDs on the V25 battery stop blinking somewhere in the middle of the third stage, as expected. Then, we see a sharper current dropoff decreasing further, while the voltage starts to decrease as well. Finally, a switched-off stage appears where the current is approximately 0mA and we see steady cell and input voltages. This process takes roughly 3.3 hours, whereas, the technical time to a state-of-charge (SoC) of 100% takes approximately 2.5 hours.
Conclusion and Continuation
In this tutorial, we showed how to read the voltage of the cells in a V25 USB Battery Pack with an Arduino board. The Arduino was wired to the V25 battery, an external power supply, and an INA219 current/voltage sensor. An Arduino code was then introduced as a way of monitoring the input voltage, load current, and cell voltage. A datalogging routine in Python acquired data from the Arduino board that represented each input and plotted the results in real time.
In the next post, we will show you how to use the cell voltage to monitor charge level and change behavior of your application. For example, when the battery starts to become low, you can put your device into a sleep mode or transmit data less frequently.
“In the next post, we will show you how to use the cell voltage to monitor charge level and change behavior of your application.”
Was the next post ever created?
I’m wondering how to better interpret the scaled voltage from the V+ pin on the V25.
My V25 V+ maxes out at ~1.85 scaled voltage (like Jose) and has sagged as low as 1.54 but also has powered off the USB ports at 1.73 scaled volts.
Love the project Josh, i’d really love some data even more. Did you ever plot the capacity of the V25 at each indicator, from shut down to fully charged or the opposite? I’d assume the trigger levels for the LEDS are different for charging vs discharging.
Hello,
Is the D+ reading on the USB port equivelent to a voltage reading accross a single LiPo cell of the battery pack? I have an older V72 battery and would be interested in approximating this circuit by attaching A0 to an internal battery lead. Does this seem like a possibility?
Can we simply connect the solar panel to the micro USB input on the V25/V75 as usual and separately tap into the D+ on the USB C input to read the battery voltage while skipping the use of the INA219 completely if we do not care about the charging current? This would mean only running the usual power cable from one of the two USB A outputs to the project along with one wire coming from the D+ to an analog pin to read battery voltage and program the project to react appropriately to low voltage states. I assume the ground coming in from the USB A will suffice for connecting the grounds across the whole system.
Hi Eric,
You don’t have to use the INA219, you just need some way to translate the analog reading into a digital one.
Hey Voltaic,
Any chances I can get a version of this for the raspberry pi? I setup a remote camera powered by your panels and battery. But after a few time it is clear I’m not getting enough sunlight to keep it on on the schedule that I created (from 8am to 8pm). I want to detect that the battery is low and reduce the consumption of the pi (turning it on for less hours). I have a Witty Pi that can read the voltage, so which pins from the USB-C breakout I need to connect to their VINs and GND? The whole system is powered through another USB port. Do I need to power it from the USB-C as well?
Hi Jose,
I would first take a step back and get a good estimate for how much power you consume and produce a day in Watt hours (Average current * voltage * time) vs the expected power production per day. If you have say a 10 Watt panel, you might produce 30 Watt hours per day in the summer, but only 10 Watt hours in the winter depending on your location in the world. We recommend this tool: https://blog.voltaicsystems.com/estimate-solar-irradiance-iot-device/
It is *complicated*, I tested the whole setup here in my window in Brooklyn, which happens to face the best sun direction. Did all the measurements, reduce the power usage to be less than the 6W panel I was using. The system run for more than a month without problems, the V50 was able to fully charge every day where the sun was partially cloud and would hold for 3 to 4 days on bad days. When I moved it to the remote area, I’m not getting anything close to that in terms of sun. Lots of trees so I get only a few hours a day. I just ordered one of your bigger panels (it’s in the mail) to see if the situation improves. I’m using a witty pi to monitor the voltage but with the scaled voltage I’m getting ~1.35 just before the battery shutdown and ~1.85 at full charge. What I’m trying to do is to re-program the rtc on the witty to run the whole setup for less time to save battery when the battery is running low, hoping that can help me go through cloudy days better.
Hi there,
I am using multiple V75 with Solar Panels, which means my input “Power Supply” is going into the side connector of the V75. Is there any way to rework this circuit to get battery level with the side micro Usb Connector?
It is technically possible to put it on the data pins of the MicroUSB input, but it isn’t a planned change. Hardware changes typically take over a year to propagate into the system.
Thank you for the reply! Would I be able to get the Power Level of the battery pack without the input, just by connecting a INA219 to the USB C or even USB A. Thank you