We recently collaborated with Nicholas Johnson to build a solar-powered air quality sensor that sends real-time information to the web for anyone to see via the cellular network. This project shows the power of solar panels for remote sensing using microcontrollers. The techniques used in this tutorial are transferable to any other sensing project that is publishing data to the web via GSM.
This tutorial details how to replicate the your own solar powered sensing project. For a brief overview about the project and the dust sensor testing results in Brooklyn NY, see the overview post here.
If you want a one-on-one conversation with someone from Voltaic about running small systems offgrid, you can schedule a consultation here:

Project Overview
This project seeks to send real-time air quality information to the web as easily as possible. Anyone with basic experience with sensors or electronics can assemble the hardware below and download the software for the Arduino to get their sensor up and running in no time. An inexpensive dust particle sensor was combined with an Arduino Uno to record pollution levels, and a GSM shield was used to send the information to the web each time a measurement was recorded. A GSM shield connects to a phone network (similar to your cell phone) and does not require a local internet connection to establish it’s own connection with the web, therefore it was used instead of a Wi-Fi shield so that we could install the sensor out in the wilderness away from any reliable Wi-Fi network.
Materials Used
- Arduino Uno
- Arduino GSM Shield
- Shinyei PPD42 Dust Particle Sensor
- Voltaic V44 Battery (see V50 USB Battery Pack)
- Voltaic 9W Panel (x2)
- Nanuk 904 Waterproof Case
- 8 Pin Male/Female Waterproof Connection Cable
- PG7 Cable Gland (for waterproof opening in Nanuk Box)
- Software: Arduino sketches for Xively and Dweet
Electronics
As the heart of the entire project, it’s important that we make sure the electronics are working properly before we assemble anything else. The GSM shield stacks right on top of the Arduino and the 3 default pins of the dust sensor plug right into the GSM shield.
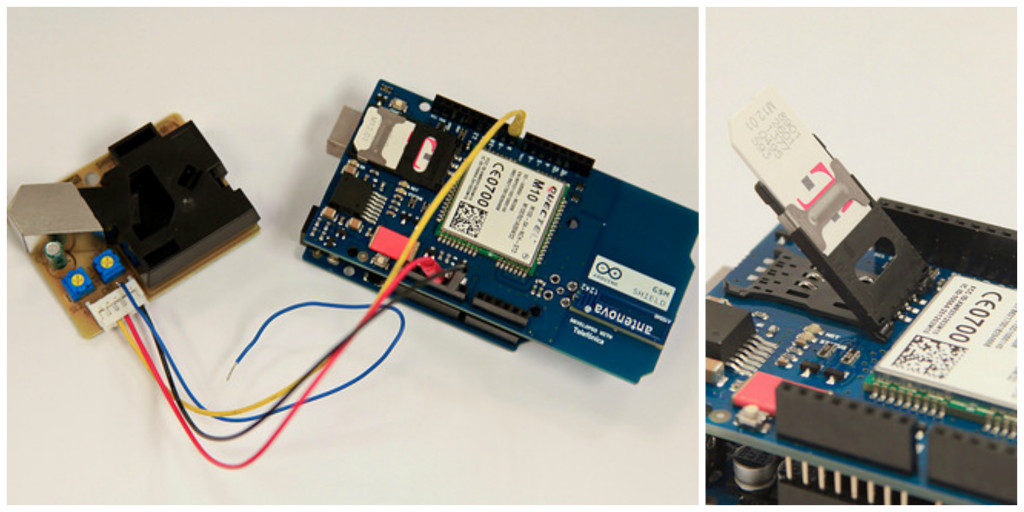
The dust sensor has a red power wire, a black ground wire, and a yellow data wire to communicate the detection of particles smaller than 10 microns in diameter. While this is fine for some air quality applications, we wanted to be able to determine the levels of dangerous air pollution, which the CDC defines as pollutants smaller than 2.5 microns in diameter (known as “Fine Particles”).
The dust sensor is capable of distinguishing between the two sizes, but only if another wire is soldered on to the connection pad. The original yellow wire will continue to detect pollutants between 1-10 microns, while the additional blue wire will detect “Coarse Particles” between 2,5-10 microns. By subtracting the coarse particles from the overall particles, we can determine how many fine particles are present in the air.
Solder an additional wire to the sensor’s connection pad between the red and black wires without accidentally touching any of the other exposed metal leads. The exposed wires can be insulated from each other with a bit of hot glue.
| Pin Connections | |
|---|---|
| Sensor Wires | Arduino GPIO Pin (24 hr Average) |
| Red Power Wire | 5V Pin |
| Black GND Wire | Common GND |
| Yellow Data Wire | Pin 8 |
| Blue Data Wire | Pin 9 |

Picture courtesy of Matthew Schroyer at MentalMunition
Purchase a SIM card with a data plan from a local cell network (we went with T-mobile) and plug it into the GSM shield. Modify Voltaic’s Arduino sketch to include your own “thing name” (without any spaces) to upload data to the Dweet.io server. Finally, upload the code to the Uno and “follow” your device to see the results in real time.
NOTE: When you modify the code to suit your own purposes, make sure there are no spaces in either the thing name or the data names that are sent to Dweet.io.
Power Conservation
For solar powered projects, reducing the power consumption of the system is absolutely essential. On cloudy or stormy days (or weeks!) the system will run exclusively off of its batteries, so every reduction in power consumption has a very tangible impact on how long the system will run. We learned a lot about reducing the Arduino’s power consumption from this Adafruit tutorial, and used pieces of their code to put our Arduino into Sleep Mode between data readings to save power.
This was more complicated than expected, since the dust sensor does not take an instantaneous reading when it wakes up but must “count” the pollution that enter into it and averages that count over a specified time interval. The Shinyei corporation says it must be on for at least 2 minutes for the sensor to warm up (there’s a small resistor that creates an internal air flow from the heat that emanates from it) so the first sensor reading may not be reliable. We found the actual warm up time to be closer to 30 seconds. This means that in order to get reliable data, we have to record several data points every time the Arduino wakes up from sleep mode.
Even after putting the Uno to sleep we were only able to reduce the power consumption by about 33%. This translated to 50% longer run-time with the same battery which isn’t too shabby. With improved hardware that naturally uses less power, we predict we could at least double the battery run-time compared to the original design.
If you are interested in putting your own Arduino into Sleep Mode, download Voltaic’s Arduino sketch with all the required code snippets for putting the system to sleep and waking it up again when necessary.
To actually power the Arduino, plug the USB-to-Serial cable into the USB port of our battery and confirm the battery is in Always On mode so that it will recover if it looses power.
Weatherproof Hardware
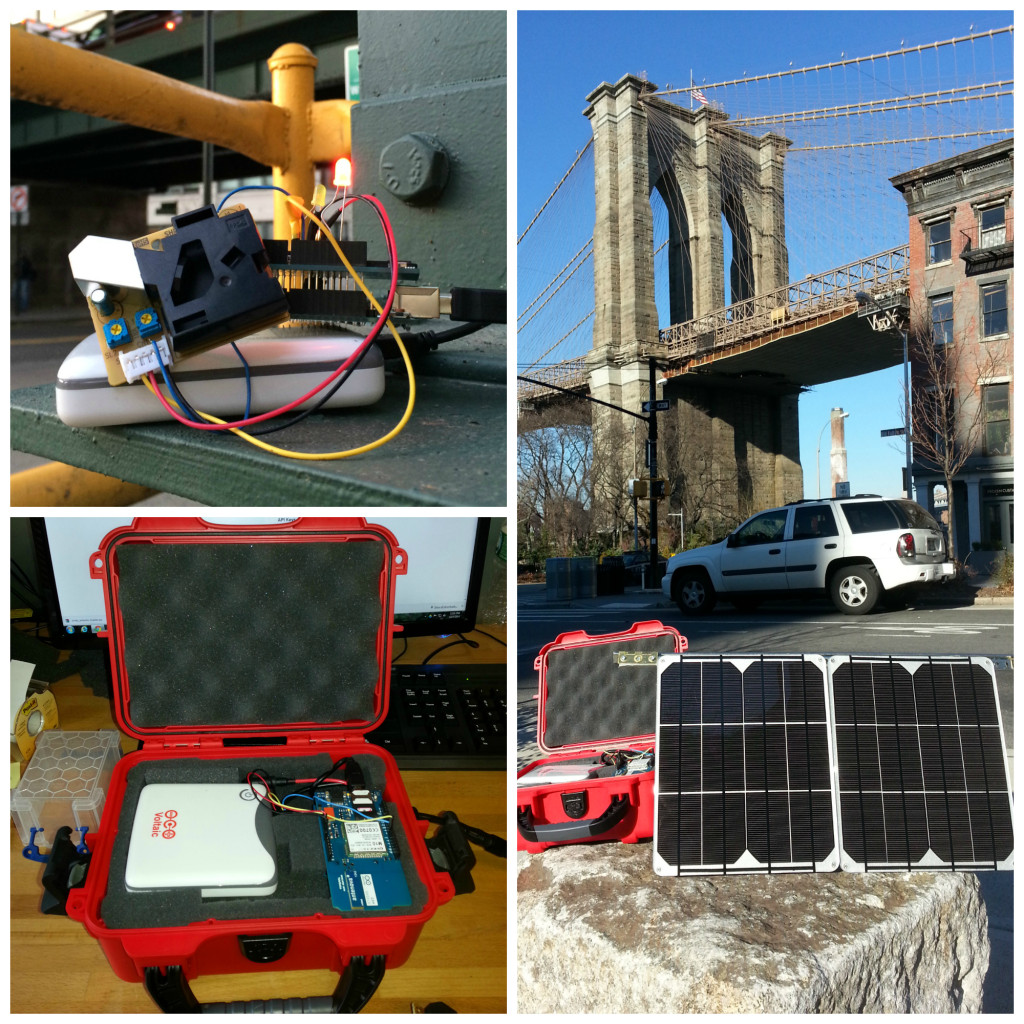
Since we wanted to install this air quality sensor outdoors for months at a time to show the robustness of our solar panels, it is important to enclose all the sensitive electronics in a waterproof case to protect them from the elements. The solar panels on the other hand are built for this type of outdoor use, as the panels and wires are extremely reliable outside in all seasons.
Of course the air quality sensor must be outside exposed to the open air, but it is not waterproof itself so it had to be sheltered from rain while still able to intake the surrounding air. We accomplished this by hacking together a small upside-down box to act as a permanent umbrella that is completely open on the bottom to allow adequate air flow into the sensor.
To see how we hacked together a Nanuk case to store all the electronics, check out this guide to making a waterproof case for Arduino sensors. As you can see from the water drops and the snow on the top of the case, the case has experienced heavy rain and snow over the last few months and it’s held up perfectly fine.

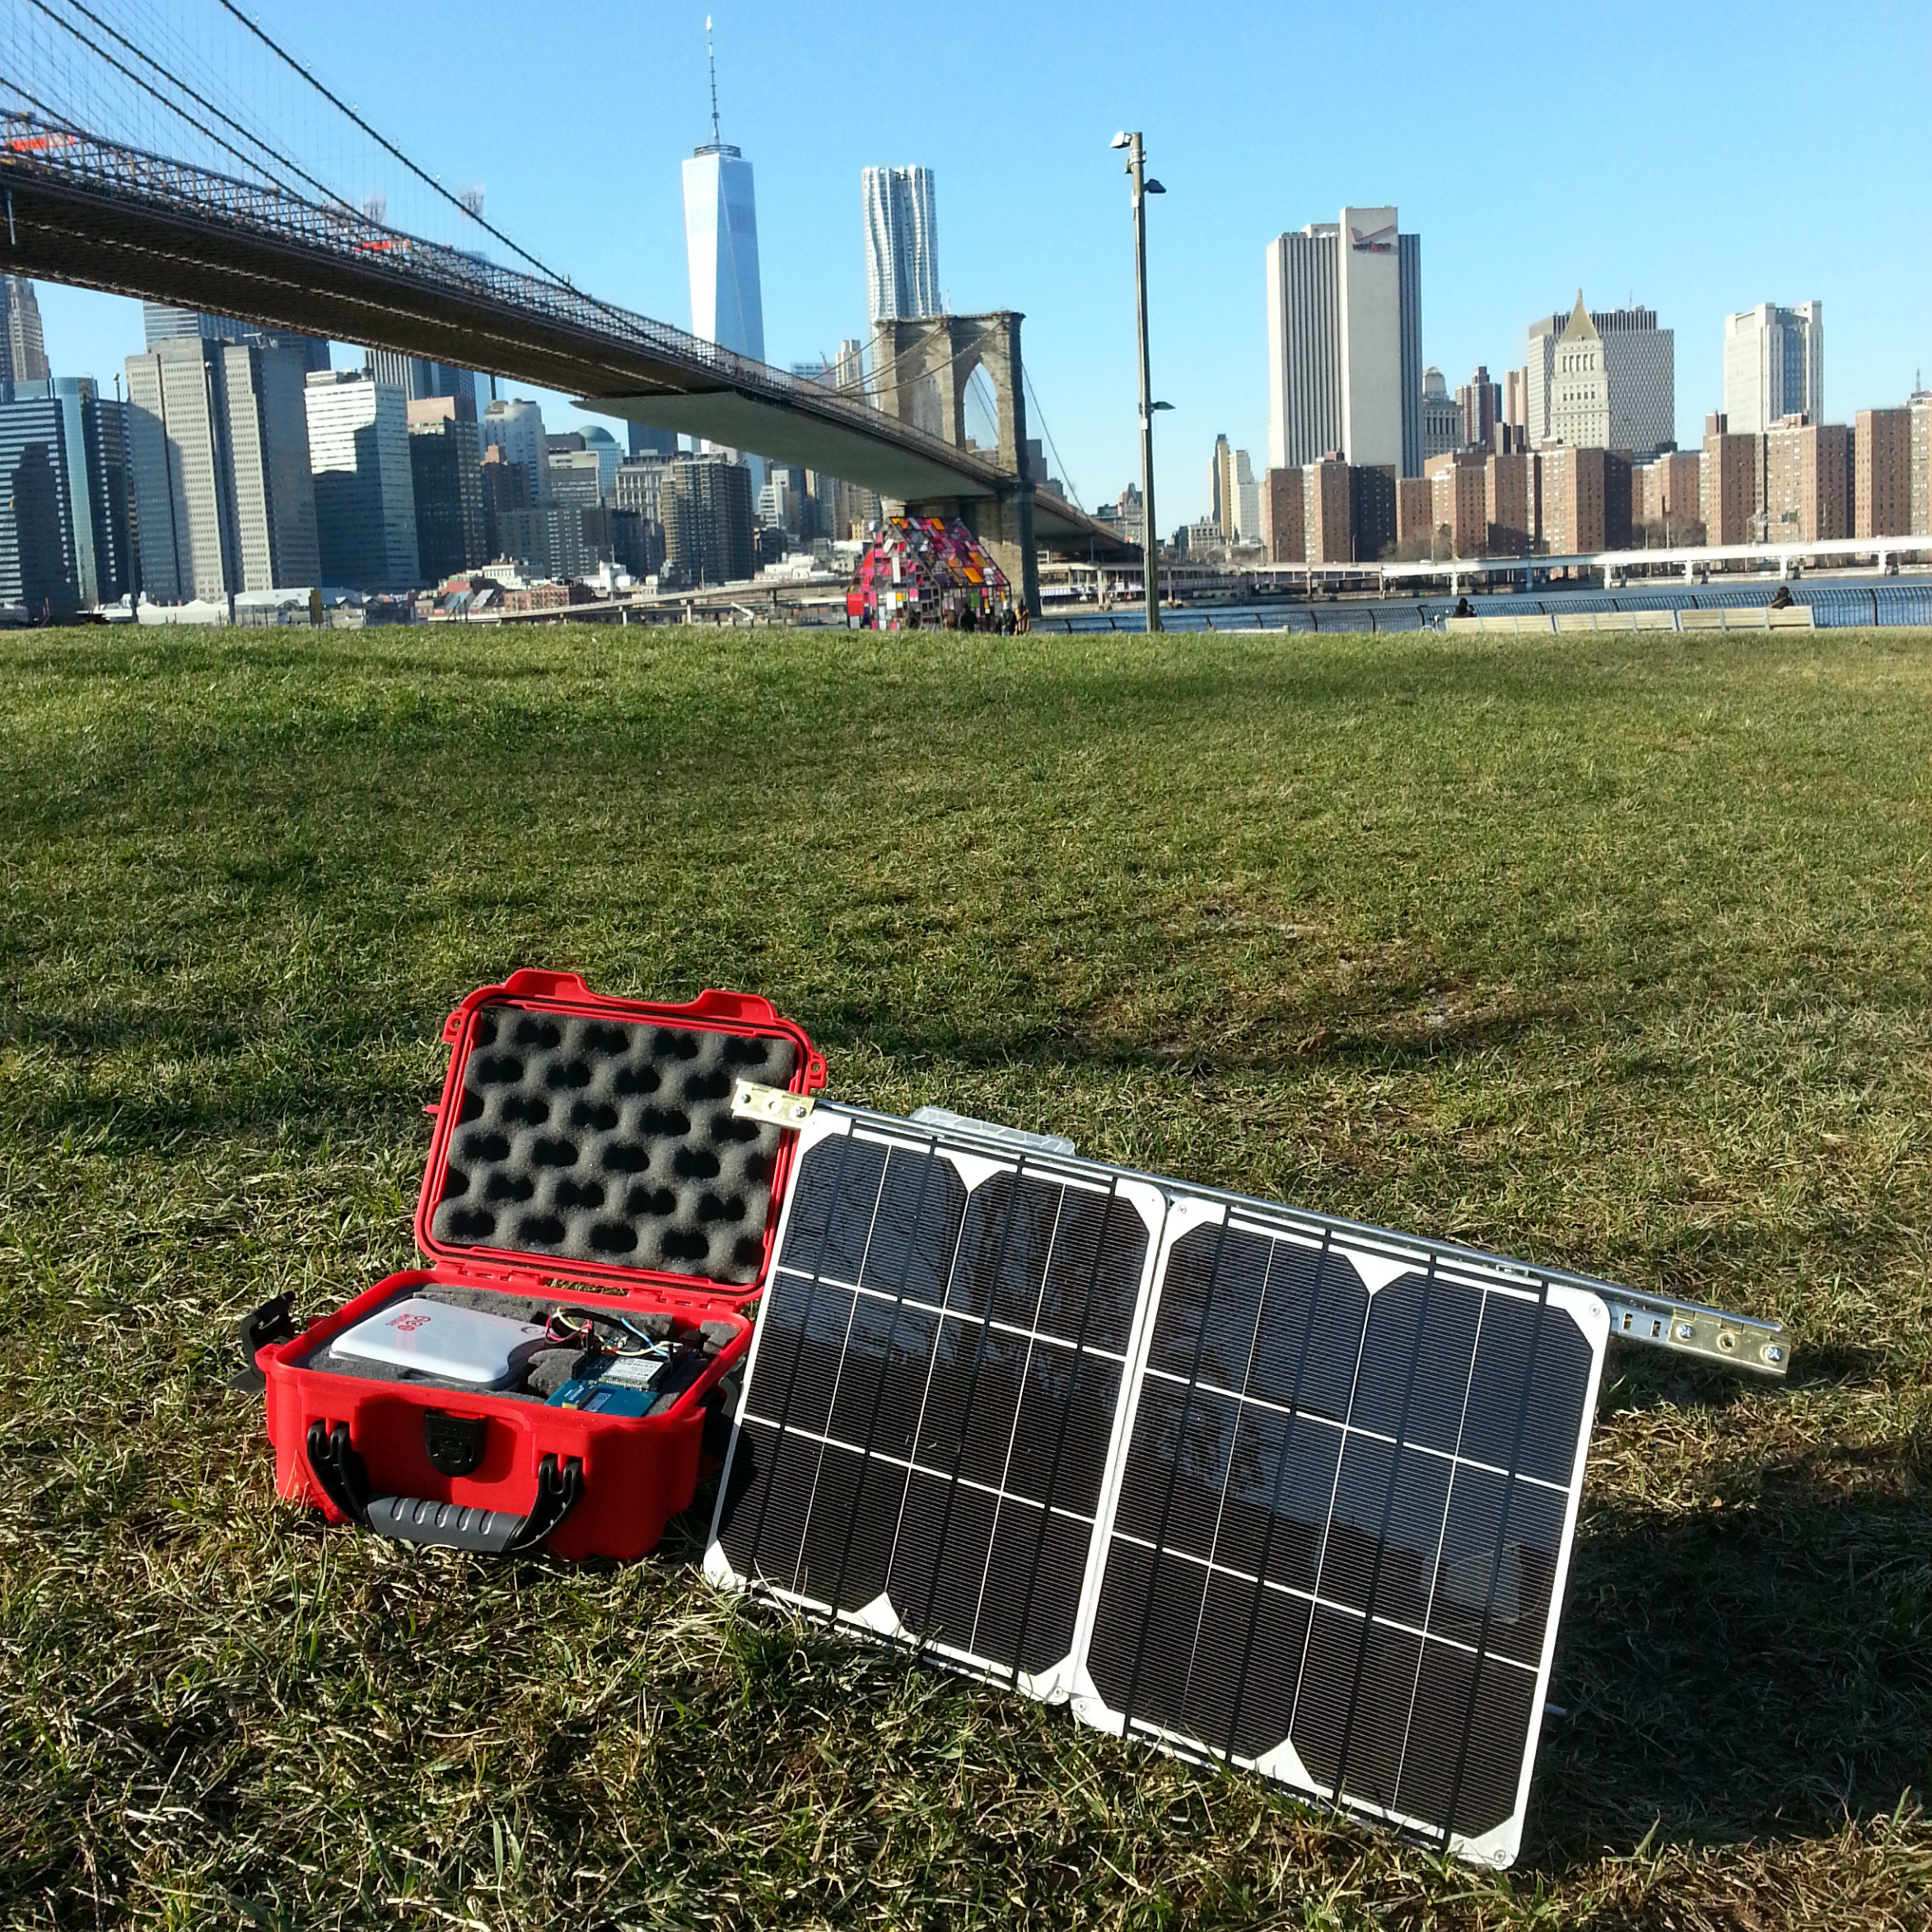
Solar Power
We’ve written before about how to power an Arduino from solar power, and we used some of those principles when deciding what battery and panel size to use for the system. We experimentally determined that the systems runs for about 18 hours from a standard V15 battery, so we upgraded to a V44 battery with more than twice the power as the V15 to last us at least a day and a half without solar power (enough for a full 24 hours of rain/clouds plus the following evening before the sun rises in the morning).

We knew we would need adequate solar panels to power the V44 on daily basis. The system burns about 16 Watt-hours of power per day, so conservatively speaking we need to generate about 32 Wh of power during daylight hours alone. This calls for at least a 6W panel, but since this is still a proof-of-concept prototype we tripled that requirement to be sure it would receive adequate power even in low-light conditions. We installed 2 9W panels in parallel for a total of 18 Watts, generating about 100 Wh’s of power per day when the sun is shining. That’s more than enough!
Posting to the Web
Now that your system is assembled, it’s time to post your data to the web. We used the data sharing platform Dweet.io for this project because it’s easy to set up (no user account or access keys required) and its visualization platform Freeboard provides a dynamic user interface. We’ve also posted this data to Xively in the past, and have included the code necessary to use Xively next to the Dweet.io code.
Using the raw data uploaded to Dweet.io, here’s another example of what our customized Freeboard dashboard looks like:

As you can see there is a very rich user interface, complete with line graphs, gauges, maps, indicator lights, and even your own original HTML if you have another application you’d like to add.
We spent an afternoon walking around Brooklyn to test out our air quality sensor and see which areas of town were more polluted than others. To see our results, check out the overview post about the results of the project.
Concluding Thoughts
Unfortunately the actual sensor values are not precisely calibrated (it would require much more precise equipment running in parallel with our sensors to calibrate if the data readings were accurate), but they are still useful for observing the qualitative differences between multiple locations. Therefore we can reasonably say for instance, “the inside of this building has 3 times more pollution than the air outside” or vice versa.
Overall this project shows the power and robustness of the Voltaic solar panels for outdoor microcontroller applications. We’d like to thank Nick Johnson for all the work he did on this project, and indirectly thank all of the blogs and websites that helped us with our research about this topic. If you’d like to receive help and support on your own solar powered microcontroller project then absolutely give us a call or send us an email, we’d be happy to help.
References
- Nick Johnson’s Blog
- United States EPA Air Standards compared with International Air Standards
- Matthew Schroyer at Mental Munition for explaining the different channels of the dust sensor
- Chris Nafis at HowMuchSnow for sharing his dust sensor counting algorithm
- Tony Dicola at Adafruit.com for explaining Arduino’s Sleep Mode
- Tracey Allen at TakingSpace.com for deconstructing the dust sensor