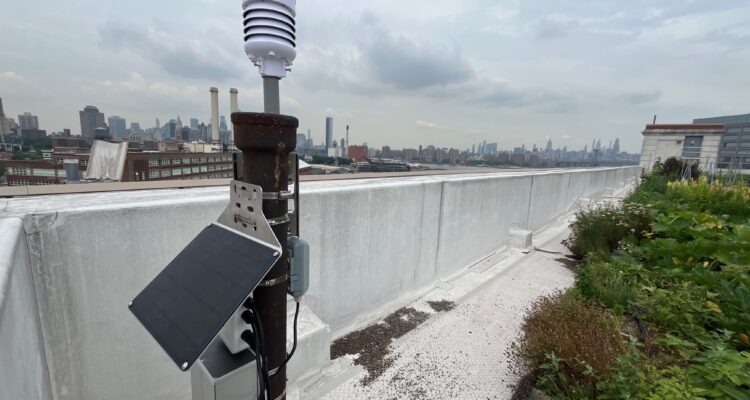
With the help of Harmony Analytica, we installed a solar powered weather station from seeed studio on the Brooklyn Grange rooftop farm. In this post, we show you how to:
- wire the CORE system to power and share data between the S700 Weather Sensor and the S2100 LoRaWAN Data Logger
- appropriately size a solar panel solution
The goal of the weather station is to provide data that can help inform and improve water usage on the farm.
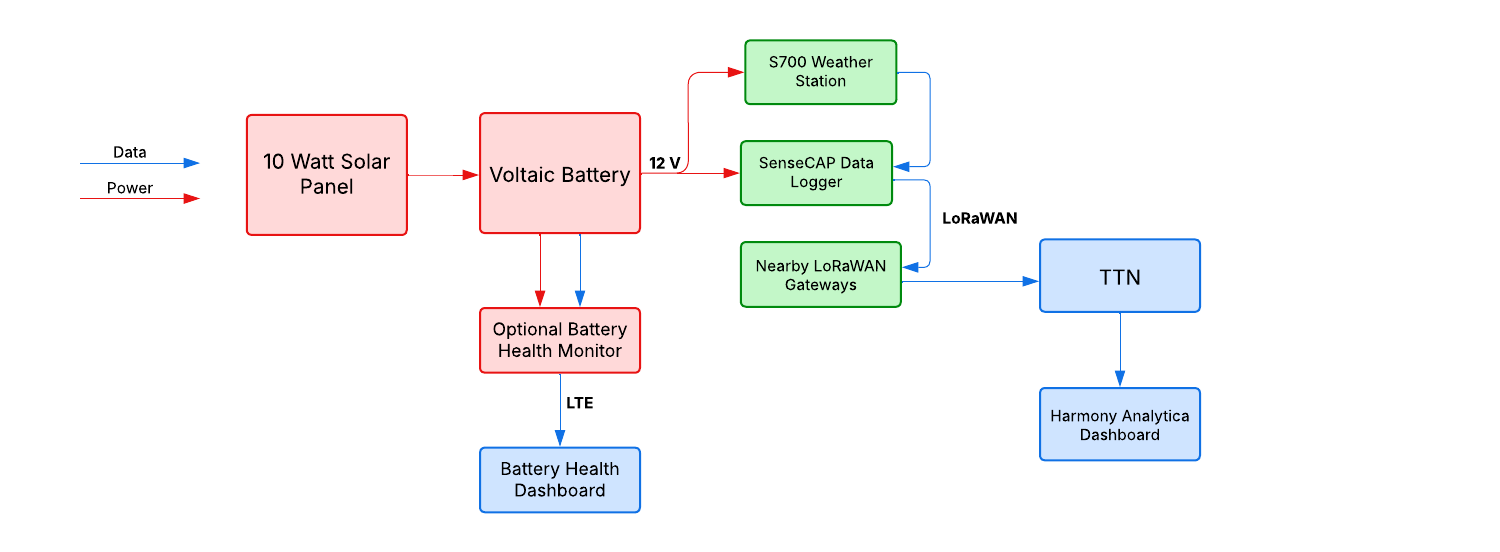
Weather Station Schematic
We need to deliver power from the Voltaic battery to both the data logger and weather sensor and connect the data lines between the two devices.
The weather sensor sends data to the data logger, then it is sent over The Things Network to the Harmony Analytica dashboard. We added our optional battery health monitor to keep track of the power performance.
Solar Powered Weather Station Hardware
We used the following components:
- S700 Weather Sensor
- S2100 LoRaWAN Data Logger
- V102 CORE LFP Battery
- Optional CORE Battery Health Monitor
- 9 Watt 18 Volt Solar Panel (P108)
- Large Solar Panel Bracket (BK103)
- 2 x PG 9 glands
- 1 x M16 Bulkhead Connector (W280)
- Hose clamps)
Solar System Sizing
We measured the power consumption and found that it was between 0.25 and 0.5 Watts with an expected daily total of 9 Watt hours. Our charge controller adds another 2 Watt hours.
We opted for our 9 Watt panel which can produce 21 watt hours per day on average or nearly 1.9X our consumption (our target is at least 1.5X). Our current smallest 12V battery is the 18Ah V102 which could power the system for 18+ days with no sun. This is oversized, but certainly workable.
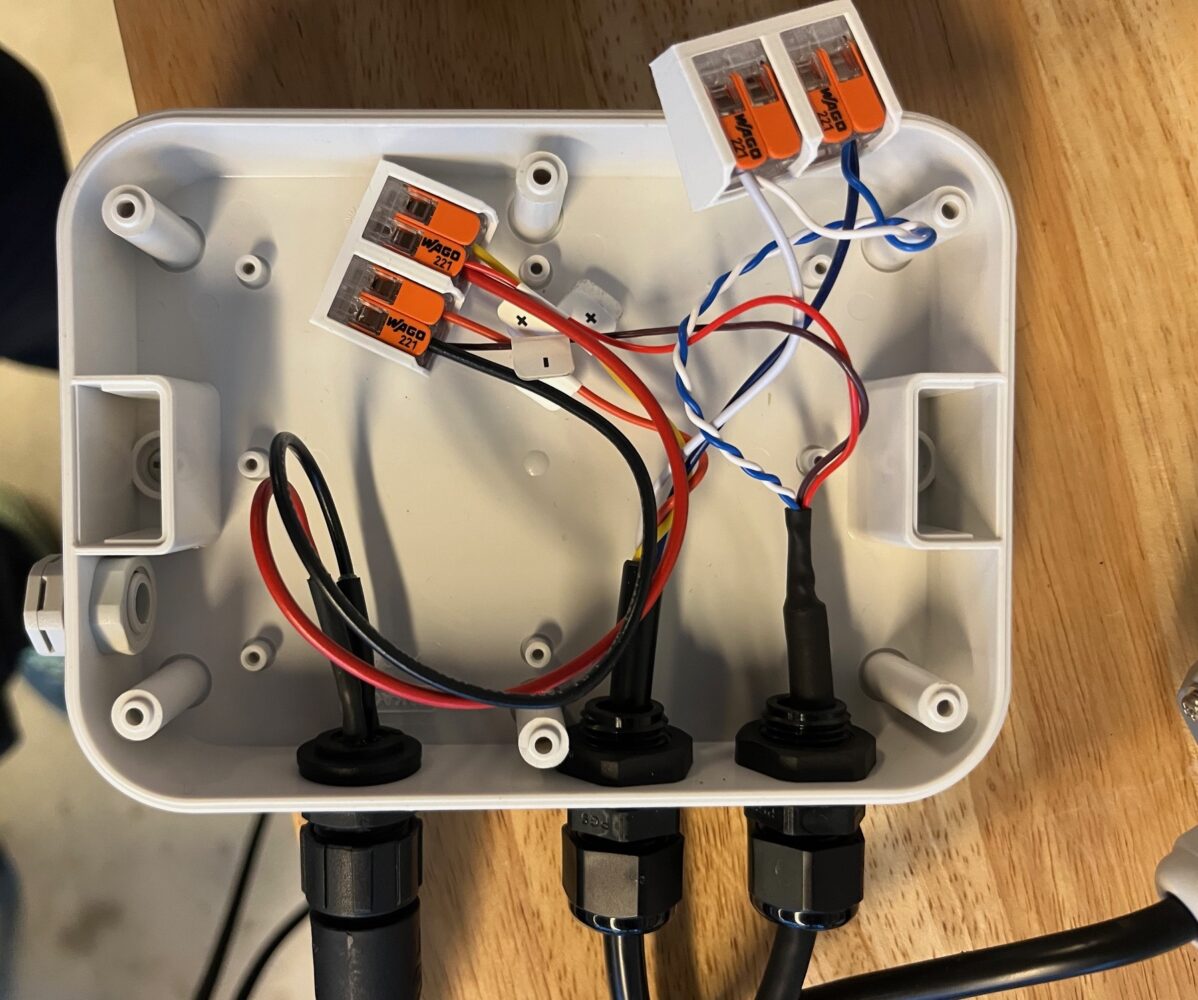
Wiring and Setup
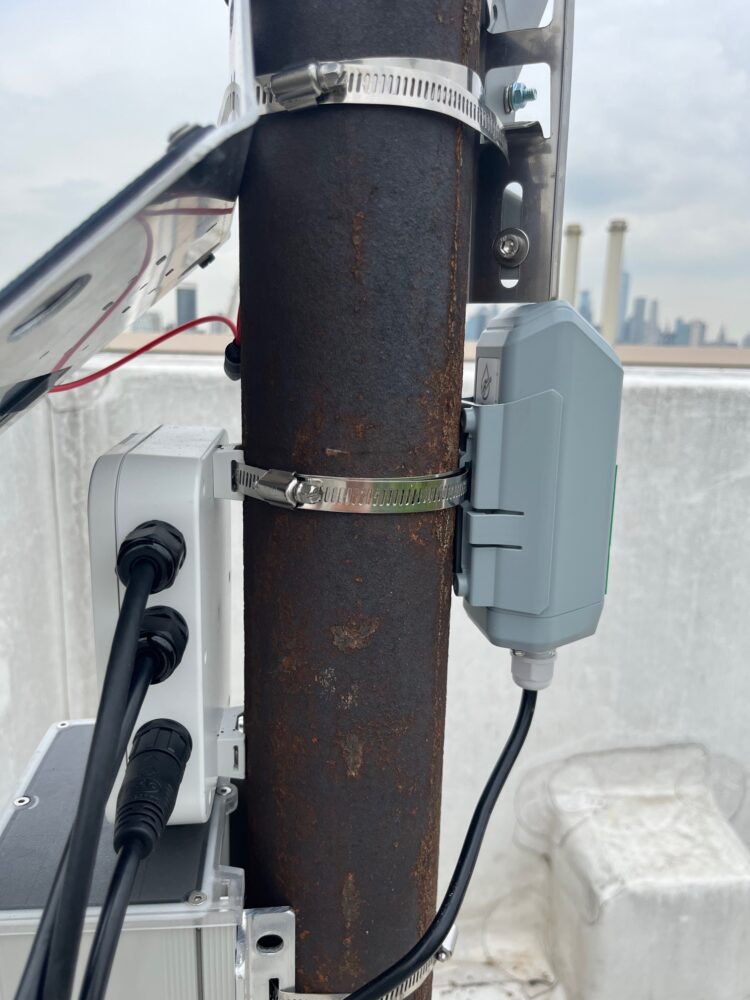
We brought the power into a small, waterproof enclosure using our M16 Bulkhead connector. We used PG9 glands to bring in the 5mm cable from the two devices and Wago clips to connect the positive and ground from the battery to the devices as well as the data lines.
Then, it was simply a matter of attaching all the components neatly to a pole.


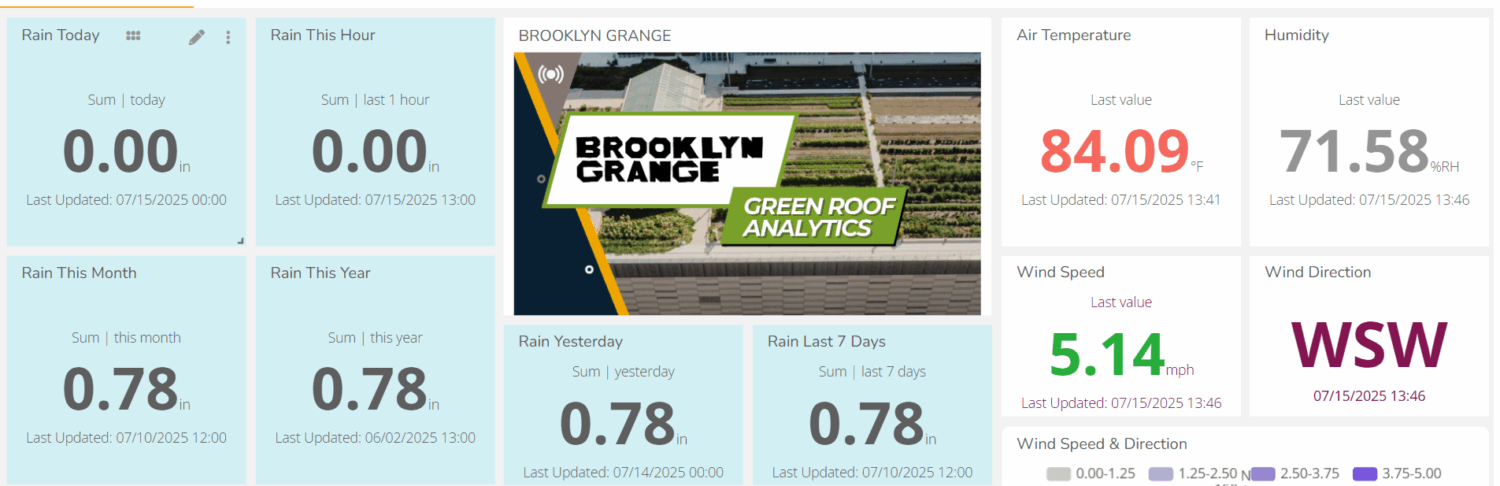
System Performance
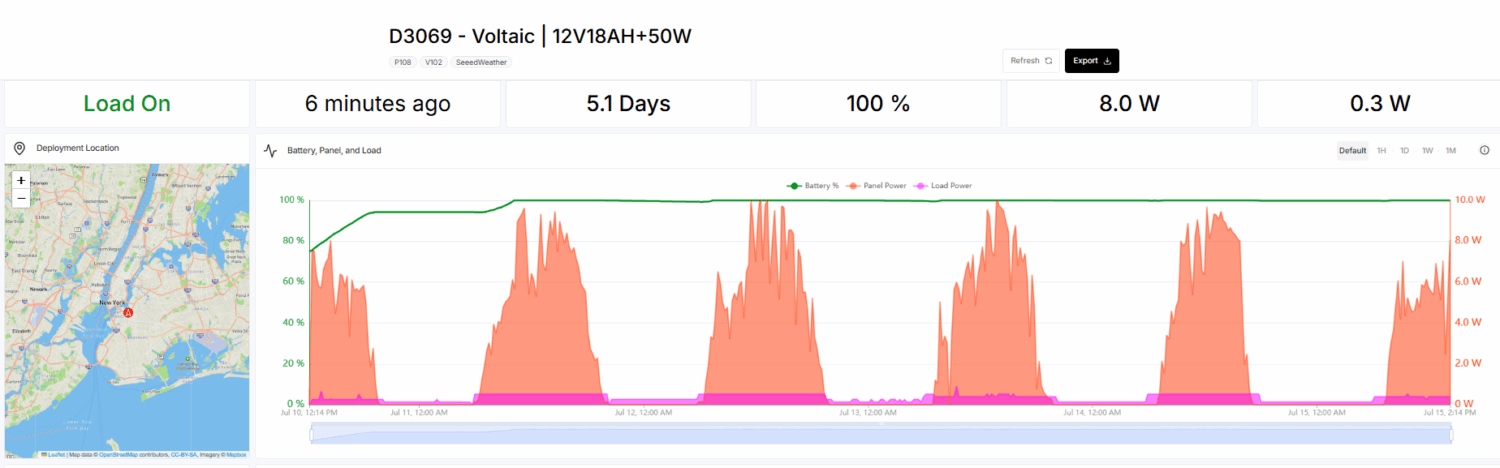
Once, installed, we can watch the weather data come in on Harmony Analytica’s dashboard and the solar and battery status on voltaicsystems.io.
The green line shows the state of charge (full), orange shows the solar panel input and magenta the power consumption. Note that the power goes up during the day when the irradiance and lux sensors are activated.
Leave a Reply