This tutorial will help you use a Seeed Studio SenseCAP S2100 Datalogger to wirelessly monitor a Voltaic CORE Solar System (voltaicsystems.com/iot) and deployed load using RS485 Modbus. We will be using a Seeed Studio SenseCAP LoRaWAN Gateway as the deployed device, but you can use this setup to monitor any panel/battery/load deployment.
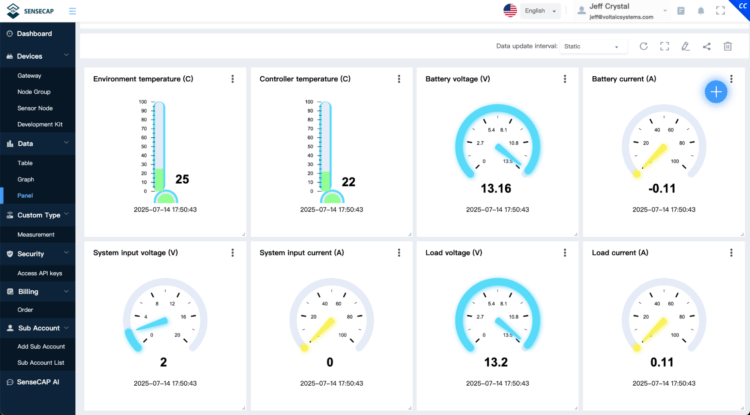
When complete, you will be able to view all the metrics of your CORE Solar System via the SenseCAP CC portal, as shown below.

Each Voltaic CORE battery has an RS485 Modbus connection which allows users to monitor battery voltage and current output, solar panel voltage and current input, and temperature. It is relatively straightforward to bring that data into Seeed Studio’s Sensecraft App.
Hardware Requirements
- Seeed Studio SenseCAP S2100 datalogger
- An iOS or Android phone to configure the datalogger
- A SenseCAP CC account to view your data (you can sign up for free)
- Any CORE Solar System
- Waterproof enclosure
- M8 connector cable
- Your deployed device (in this tutorial, a SenseCAP gateway)
Connect Datalogger to the CORE Battery (Data and Power)
Connect to the battery M8 port
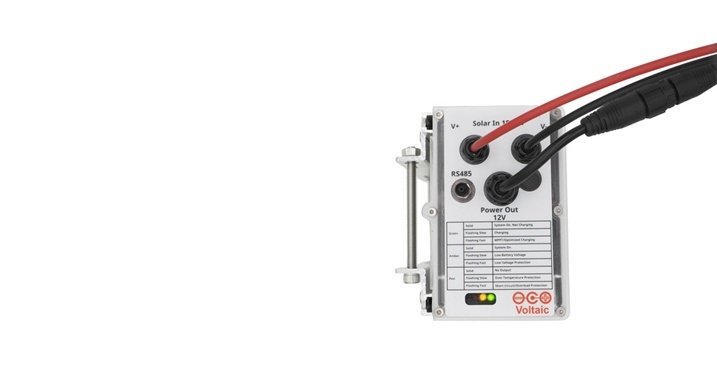
The RS485 M8 port on a Voltaic CORE battery has four terminals: V+, GND, RS-485 A- and RS-485 B+. You can find full RS-485 documentation on the Charge Controller RS-485 Guide webpage.
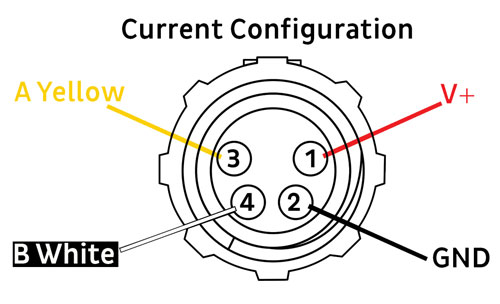
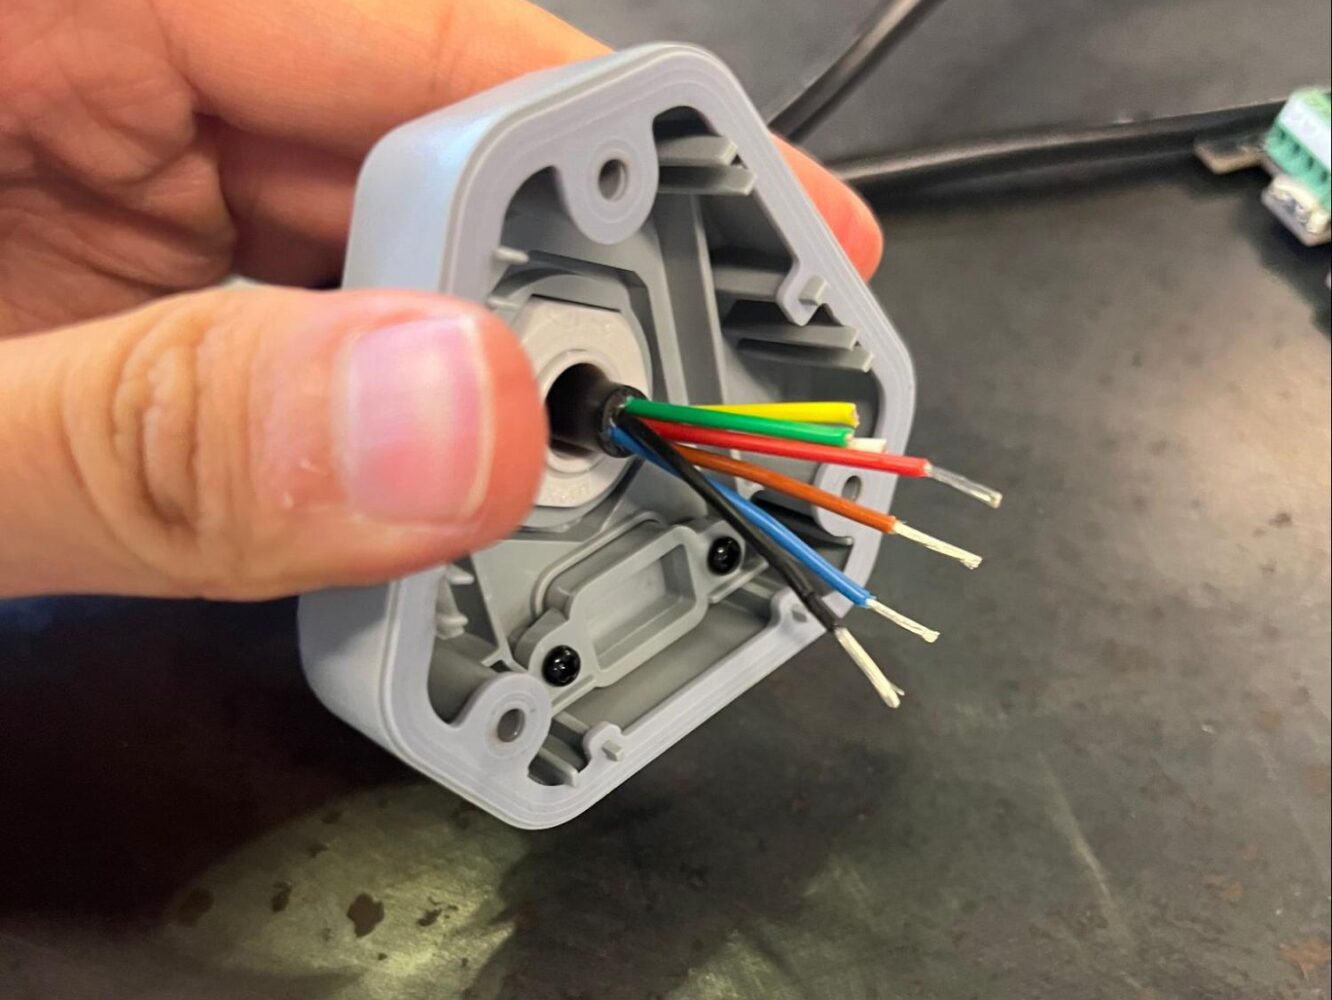
Connect one end of the M8 cable to the battery, and strip the wires on the other end. Note what color corresponds with what pin. On a standard cable:
| Pin | Wire color |
| V+ | Red |
| GND | Black |
| A+ | Orange/Brown |
| B- | Blue |
Connect to the Data Logger
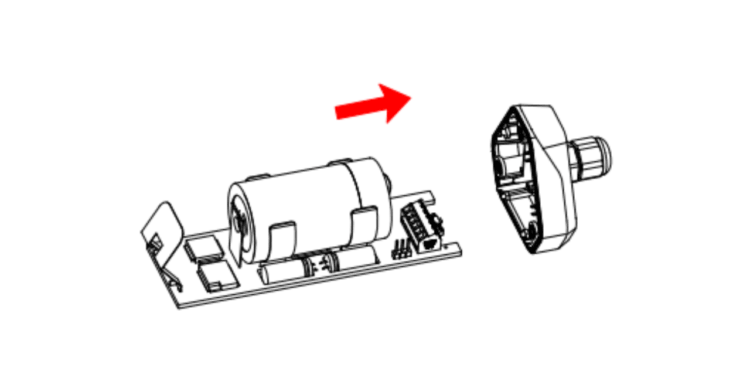
First, disassemble the data logger. Unscrew the three screws to pull out the cover, and then pull the board out of the cover.
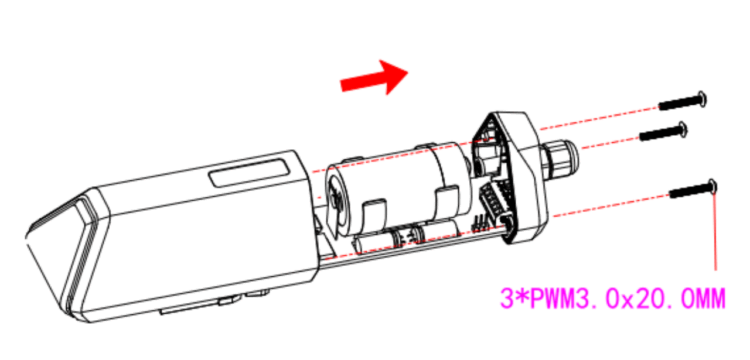
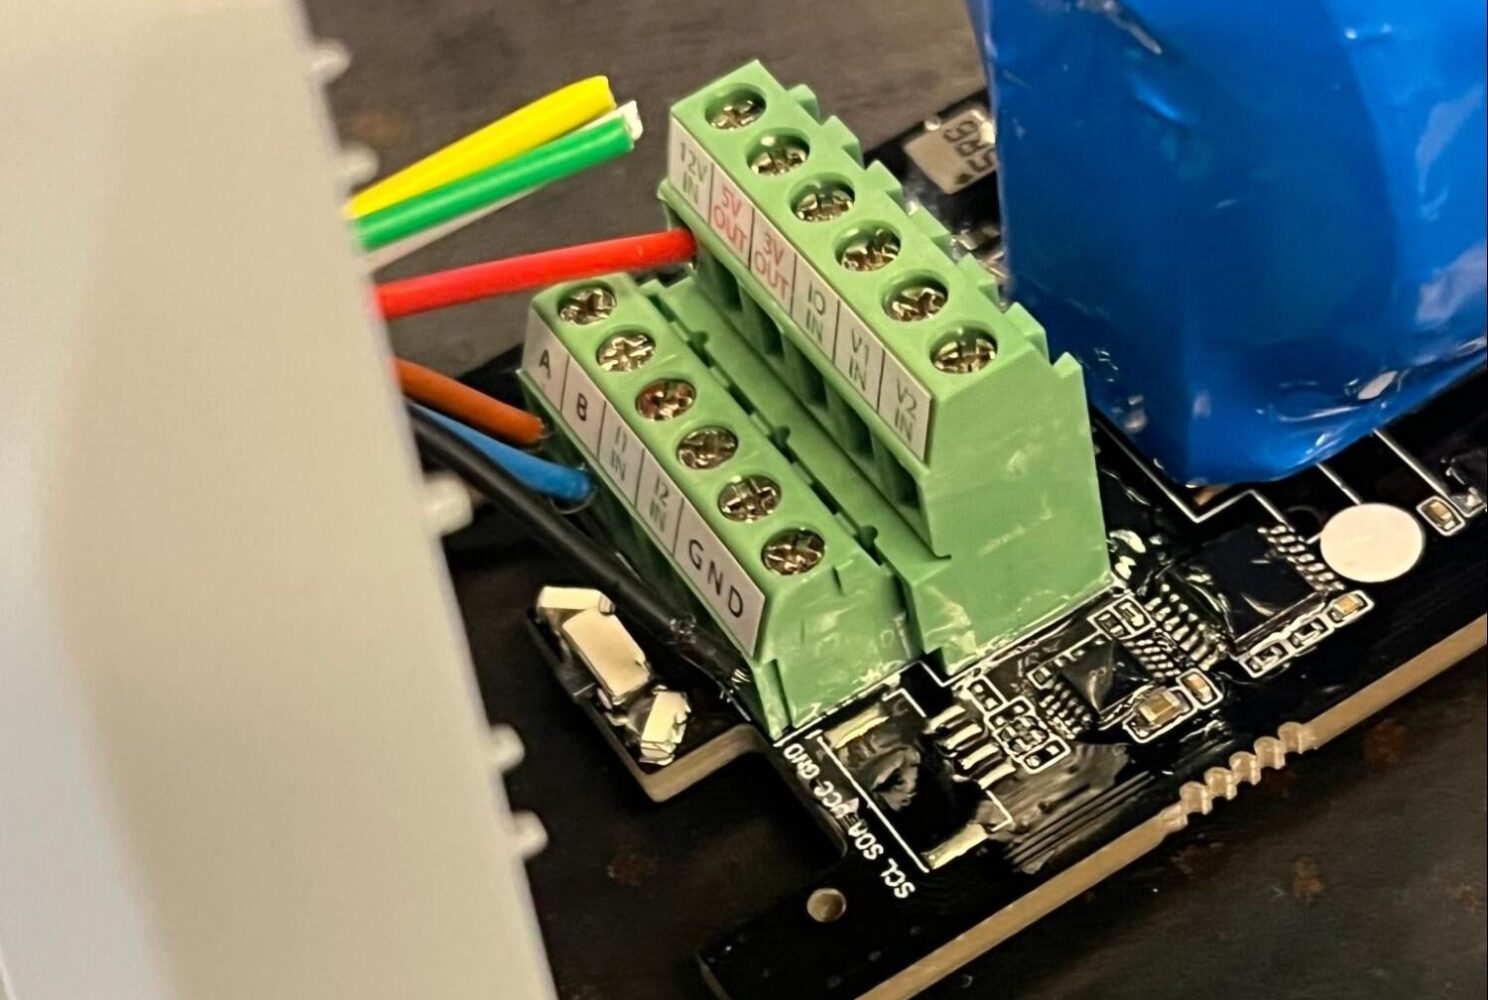
You should see screw wire terminals exposed. Feed a stripped M8 cable through the cover, and connect wires to the “12V IN”, GND, A-, and B+ terminals, using the same colors as in the battery M8 cable. (Note that in the photo below an M12 cable is used, so it has two extra wires, which are unused. You can use any cable that will fit and has four accessible wires.)
Once all wires are connected, reassemble the data logger by pushing the board back into the cover and screwing the cover back into place.
Connect Wires in Waterproof Enclosure
Take the other end of the data logger and battery wires and feed them into your junction box.
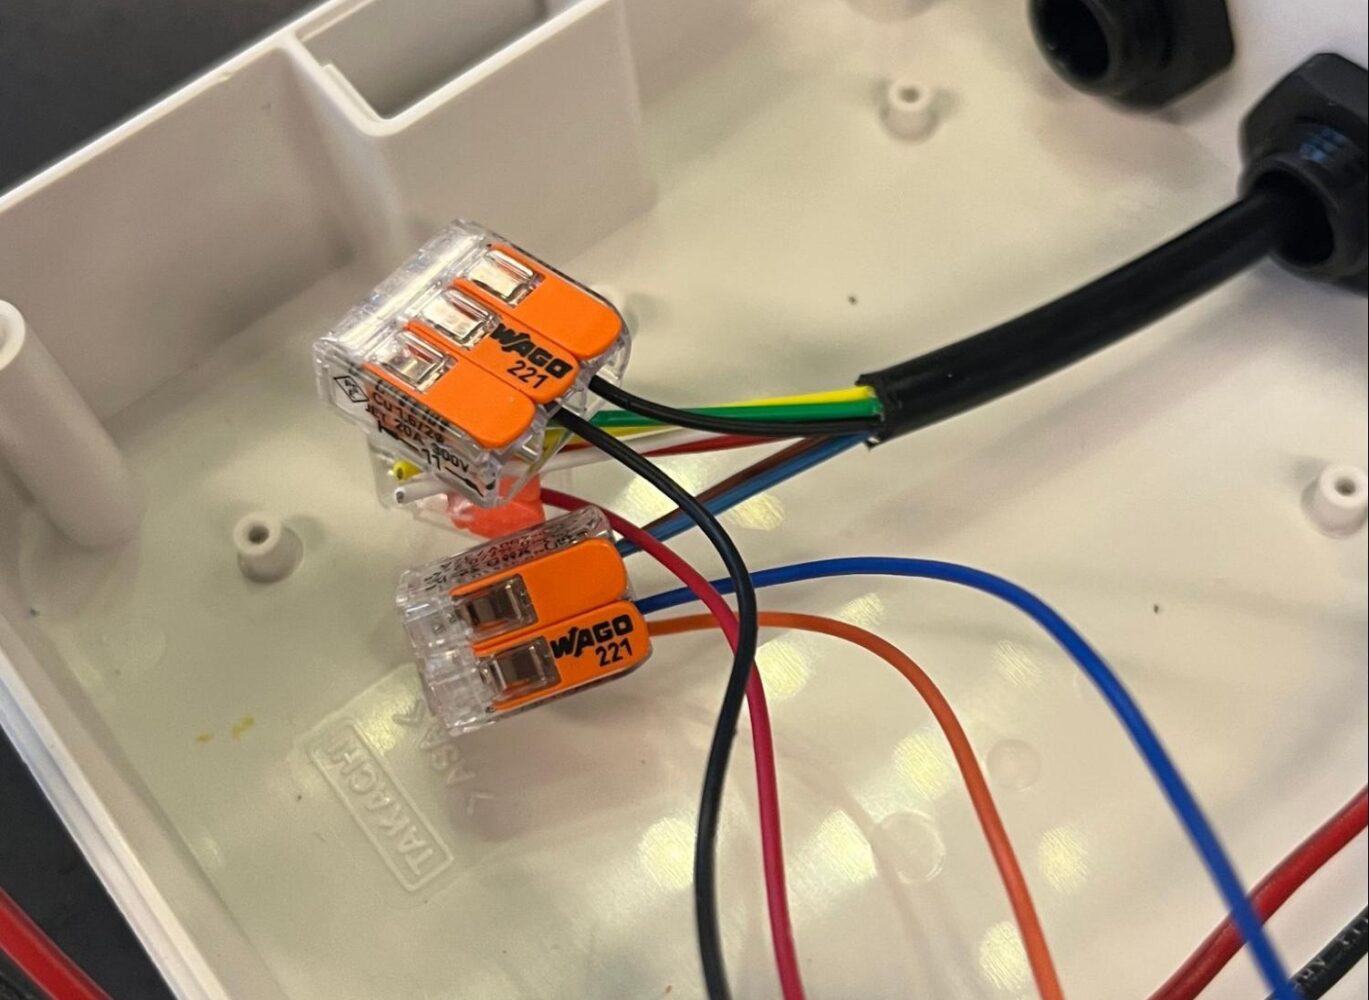
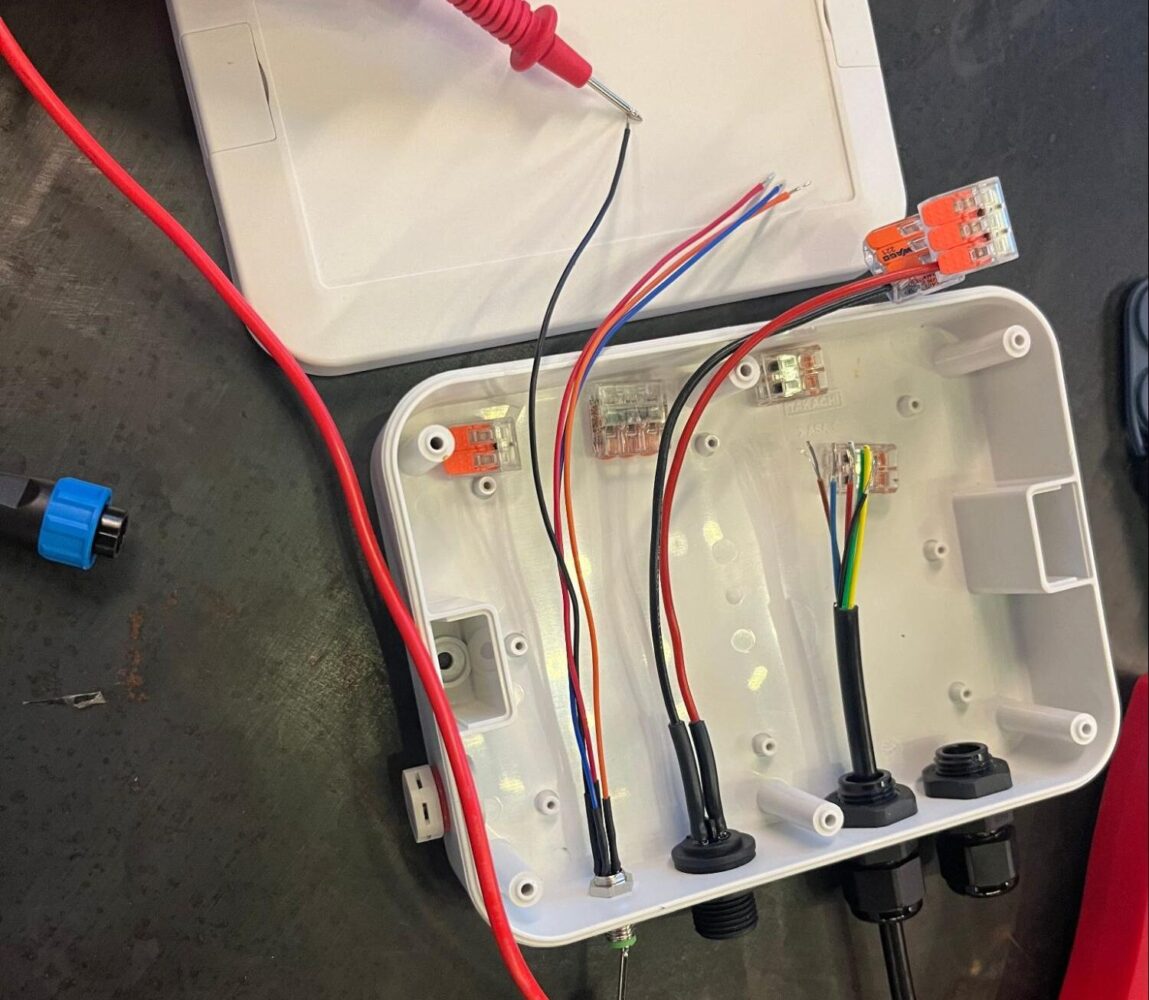
Connect each of the corresponding wires to each other (A+ to A+, B- to B-, GND to GND, V12IN to V+), matching the colors from the earlier steps. You can solder them or use any wire connector; in this tutorial we’re using Waygo quick connectors with levers.
Set up your Data Logger
Now that the data logger and battery are wired together, we are ready to configure the data logger to read status measurements from the battery.
First, set up the data logger in the SenseCraft iOS/Android app, then enter the Modbus configuration for the battery through the app to complete setup.
Power on Your Battery
Before configuring your data logger, power on your battery by connecting any cable — with a load or not — to the M16 port of the battery.
You should see the battery’s green and yellow lights turn on.
Install the SenseCraft App on Your Phone
Download link for Android: https://play.google.com/store/apps/details?id=cc.seeed.sensecapmate&hl=en-US
Download link for iOS: https://apps.apple.com/us/app/sensecraft/id1619944834
Once you download the app, log in using your SenseCAP CC Portal account. If you do not yet have an account, register for one at this link: https://sensecap.seeed.cc/portal/#/register
Add the data logger on the SenseCraft app
Once logged into the SenseCraft app, press the green “+” button in the upper right corner and scan the QR code on the side of the data logger to add the logger to your account.
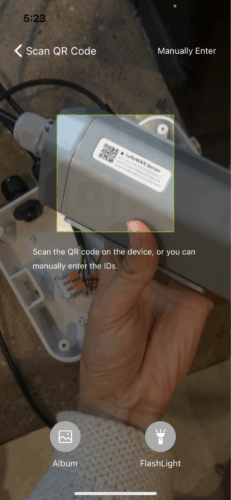
If scanning doesn’t work, manually enter the ID written on the data logger.
Configure the data logger on the SenseCraft app
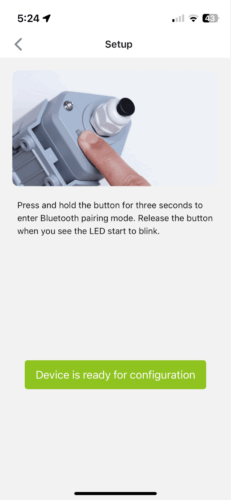
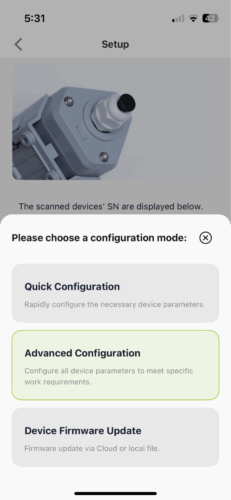
After the device is added, select “Device Bluetooth Configuration.” When you see the “Setup” screen, press and hold the button on the data logger for three seconds. You should see the LED start to blink green.
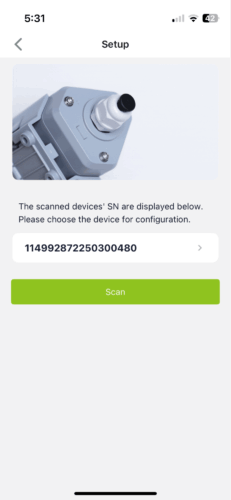
Once the LED is blinking, press “Device is ready for configuration” in the app. Then press the appropriate serial number in the app, and press “Advanced configuration”.
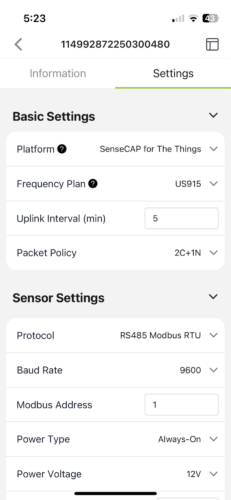
Go to the “Settings” tab. Under Basic Settings, select the platform and frequency plan that is appropriate. In the U.S., select US915 for the frequency.
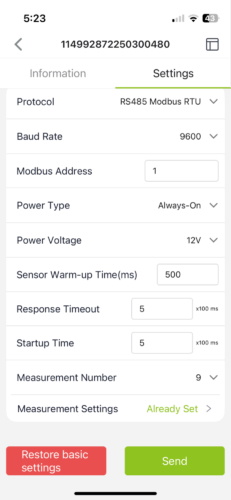
Under “Sensor Settings”, select RS485 Modbus RTU for “Protocol” and a baud rate of 9600. Set the Sensor Warm-up Time, Response Timeout, and Startup Time to 500 ms.
Set the measurement number to 9, then press “Measurement Settings” to continue.
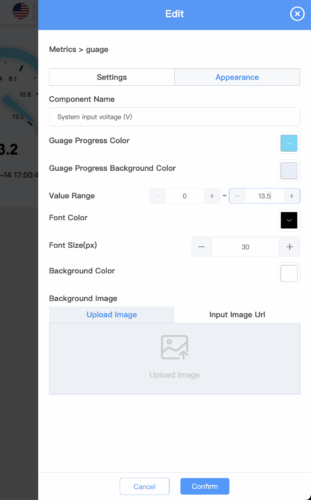
In the Measurement Settings screen, we are going to set up measurements based on the Charge Controller RS-485 Guide on the Voltaic Systems website. Specifically, we are going to reference this table:
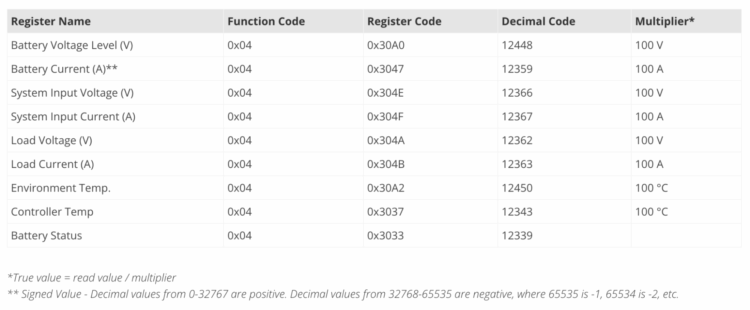
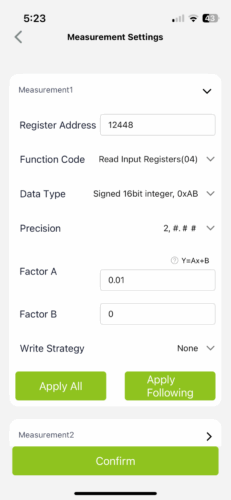
For example, in order to read the Battery Voltage Level: expand the dropdown for “Measurement1.” Set the address to 12448, as indicated by the “Decimal code” column of the table above. Set the function code to Read Input Registers(04), and the data type to “Unsigned 16bit integer, 0xAB.” Set Precision to 2 and Factor A to 0.01 (corresponding to the 100 V multiplier in the table). See the screenshot below for reference.
Since all of the measurements except Battery Status have a multiplier of 100 units and use the same function code, we can click “Apply All” to apply these settings to the following eight measurements.
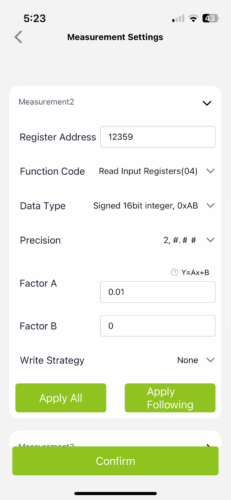
Continue configuring the measurements one at a time. For example, for Battery Current, expand the dropdown for “Measurement2” and set the address to 12359. For this measurement, you will need to change the data type to “Signed 16bit integer, 0xAB,” as indicated by the asterisk in the table. For Measurement9/Battery Status, you should leave Factor A at 1. For all other measurements, stick with the previously applied settings (same as Measurement1).
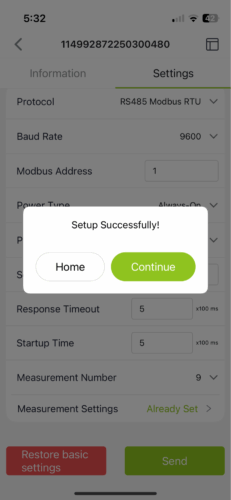
Once you are done inputting the Measurement settings, go back to the main settings screen and press the Send button at the bottom of the screen. You should then see a dialog that says “Setup Successfully!”
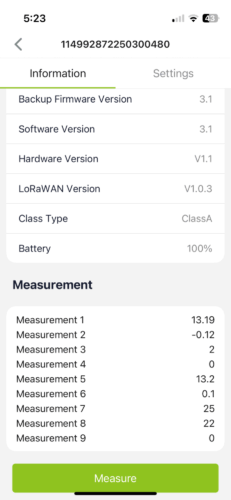
If you press “Continue” after this dialog and return to the Information tab, you can press the “Measure” button to see a live readout of your measurements. Check that these measurements are within your expected bounds.
Now you are done configuring your data logger. If you exit out of the configuration screen, your data logger button should pulse red and connect to the network you specified in the settings, and should show up as “Online” on your phone.
If your data logger does not connect, you can short-press the button to trigger the red pulse and network search again. If your device continues to fail to connect, check that the network you selected has coverage in your area, and that surrounding buildings or structures are not blocking the signal.
Set up SenseCAP Portal to display your data
On your computer, navigate to https://sensecap.seeed.cc/ and log in with your SenseCAP account you created earlier.
Under the “Sensor Node” sidebar page, you should see your data logger.
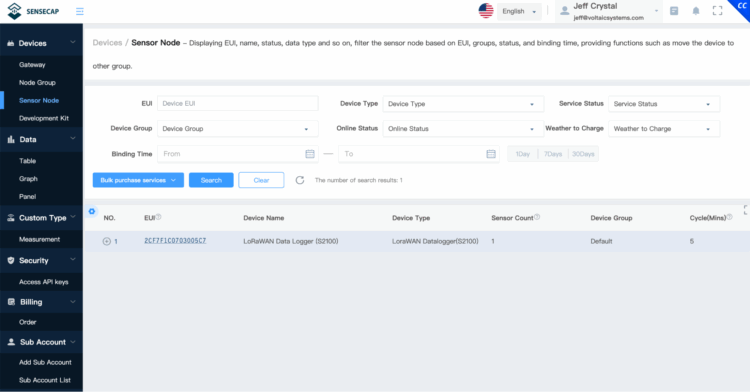
If you click into the data logger and scroll down, you should see the latest uplink of data from your battery.
To display this data in a more readable way, go to the Panel page in the sidebar, and click Add New Panel. Give your panel a name, then you are ready to add components to display your data. There are many options available for displaying your data. For example, let’s set up a gauge to display voltage data.
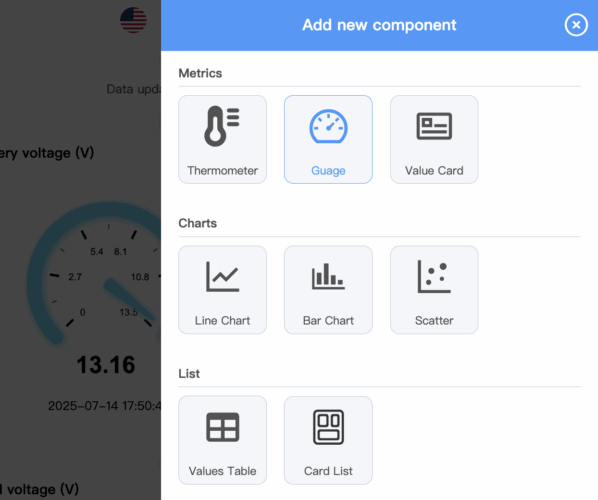
Press the blue + button in the top right, then select Gauge. Select your data logger, and the appropriate measurement number for what you want to display.
Give your component the appropriate label and range, and you should see it show up in your dashboard.
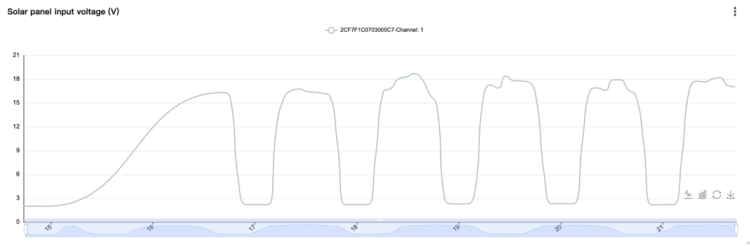
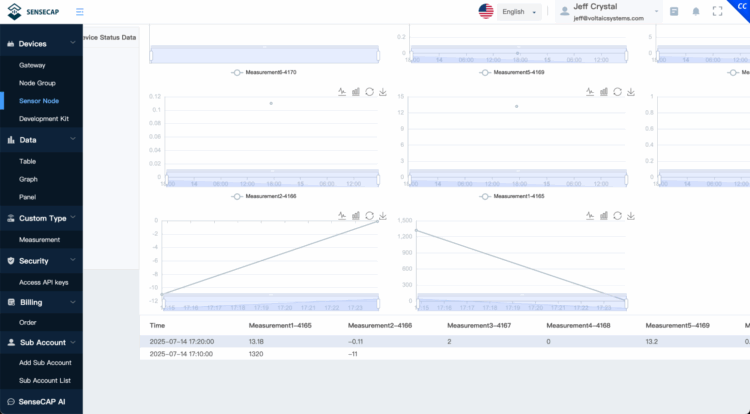
You can also add time-series plots using the Line Chart component.
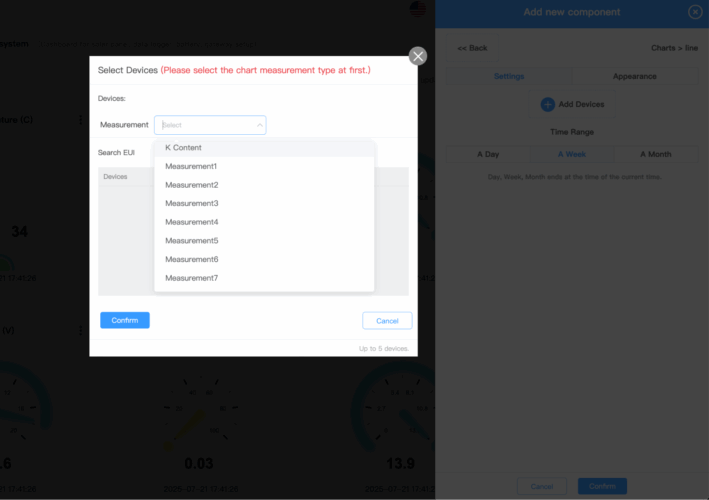
When creating the new component, click Add Devices, and then select the measurement you want to plot in the dropdown menu. This will bring up the data logger and allow you to select its corresponding data output to plot.
Here is an example of time-series data for solar panel input voltage over a week:
Deploy your setup
With that, you are ready to deploy your setup! For this tutorial, we deployed our charge system and data logger with a solar panel and LoRaWAN gateway outdoors:
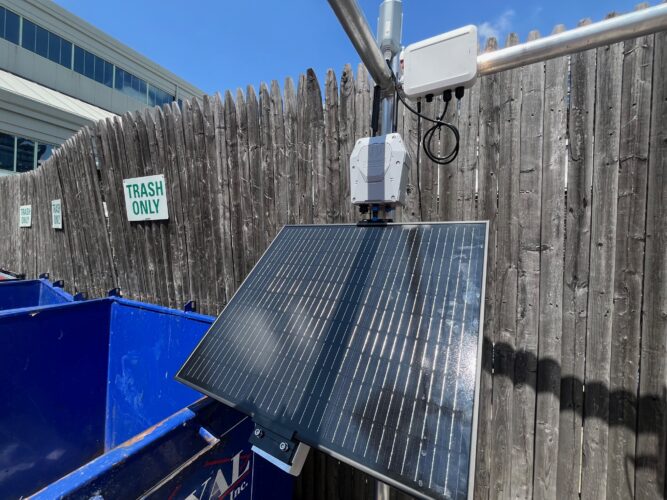
You can swap out the gateway for any device you want to power, or even add a sensor and second data logger to collect data.
With this setup, you can receive real-time telemetry from your solar panel and charge system deployment, and speed up problem diagnoses and reduce downtime. Learn more about using solar to power gateways and routers.
Leave a Reply