When customers have solar system performance issues with city deployments of IoT devices, the first question we ask is “what are the coordinates?” Then we immediately open ShadeMap.
ShadeMap visually shows shading on nearly every location by time of day and time of year. It allows us and our customers to quickly assess the relative performance of multiple locations and adjust our solar sizing model to account for the reduction in performance.
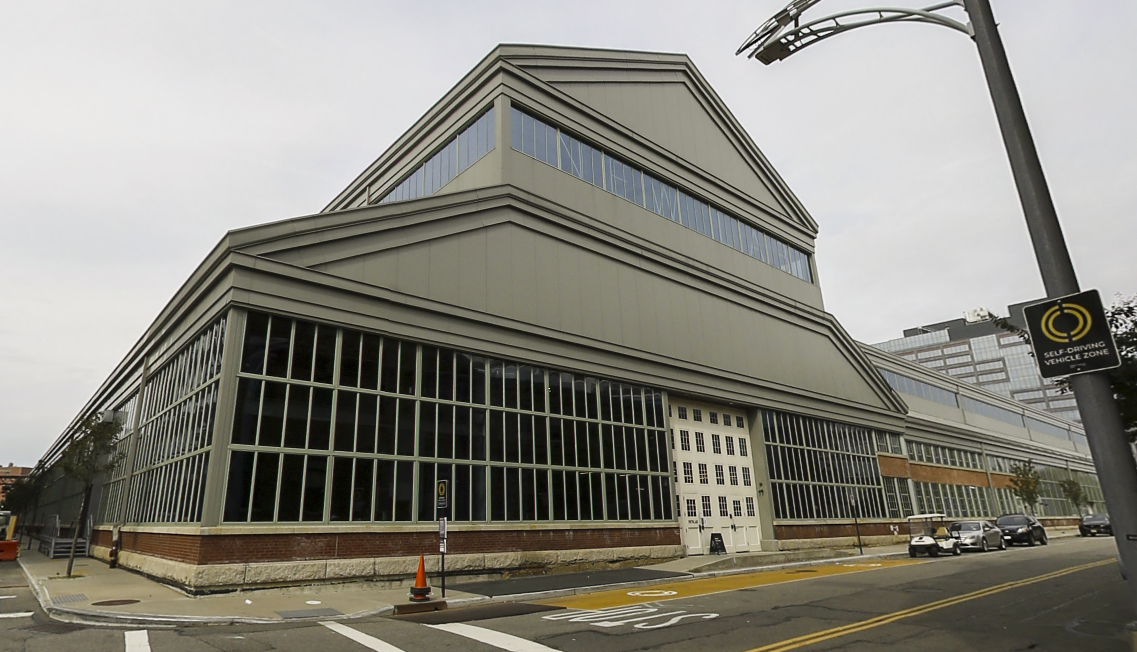
Lets look at the location in front of our office in New Lab in the Brooklyn Navy Yard in June (summer solstice) and December (winter solstice). A quick look on Google Maps and you’d think it looks ok. Nearby buildings aren’t particularly tall and the street is fairly wide.
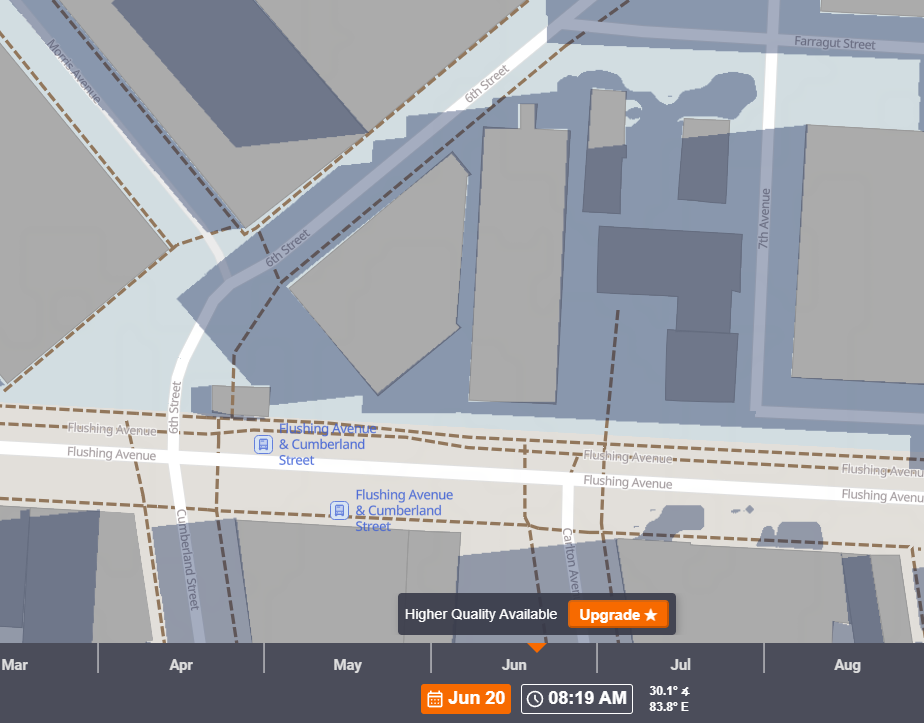
If we look at ShadeMap in June, we see that it starts to receive direct sun around 8AM.

It then starts to get shaded around 5PM. Overall, not too bad.
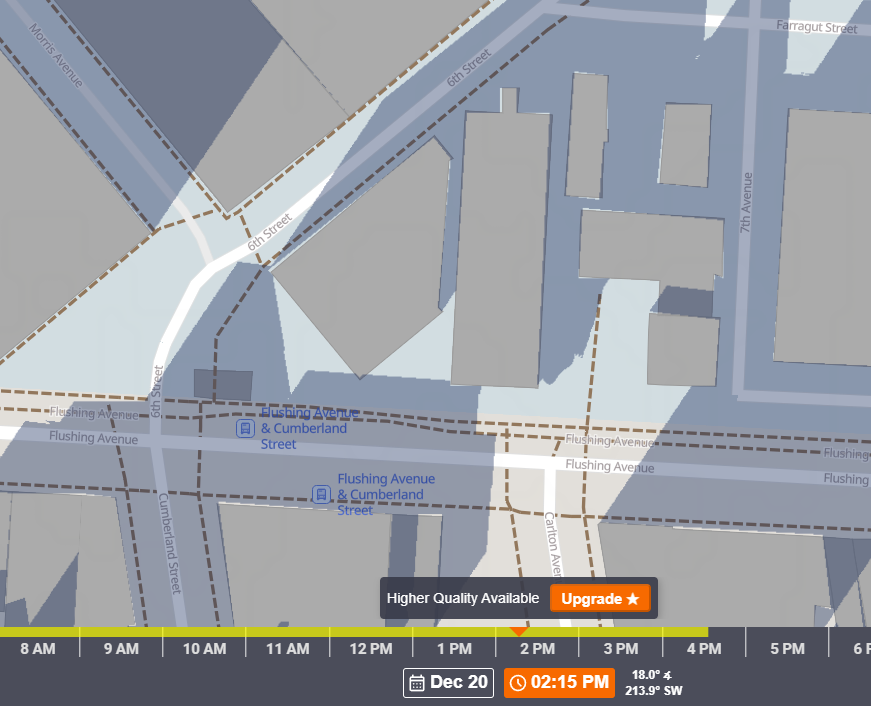
In December, it is shaded for most of the day except for when the sun sneaks through in the early afternoon. It will maybe only get an hour of direct sun a day.
If we were trying to deploy a device in the Navy Yard, we can scan nearby locations and pick one that has better sun exposure. This is two blocks away on 5th Street.
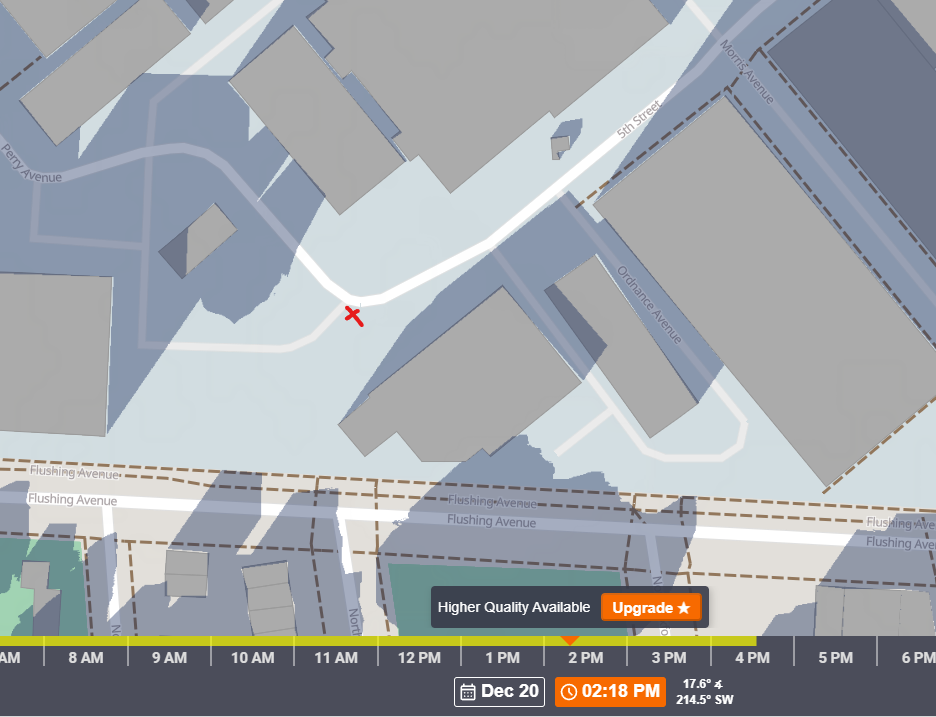
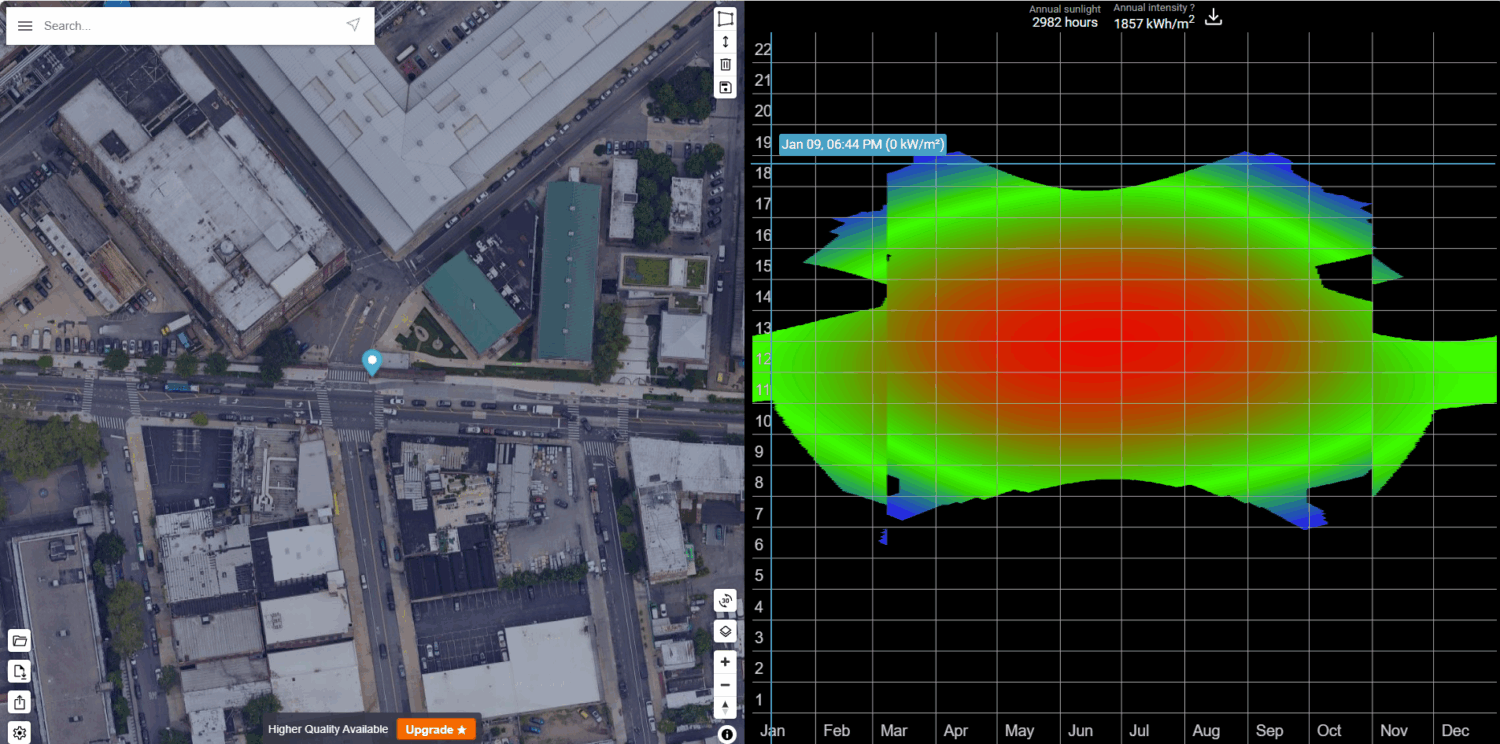
To take it to the next level, you can even show the solar intensity at the location. It doesn’t account for panel angle or rotation, but will provide a numeric value to back up the more visual shading feedback from the tool. This location next to our office receives 1776 hours of direct sunlight a year.

100 feet to the south at the Navy Yard entrance receives nearly 3,000 hours of direct sun, nearly twice as much.
Next time you are looking to deploy a solar powered IoT device in an area with buildings, trees or other physical structures, we highly recommend looking at ShadeMap.
Leave a Reply