
Project Overview
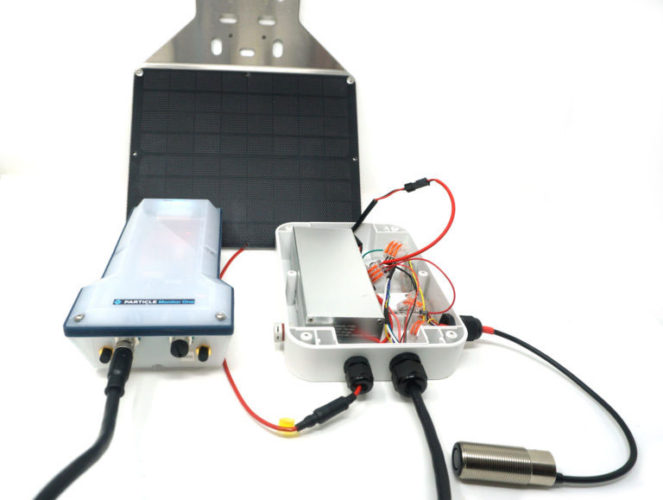
We deployed a solar powered water level monitor in New York Harbor on Governors Island using Particle’s Monitor One Developer Edition. Similar to the Tracker One, the Monitor One is a code free cellular device but it has a larger waterproof enclosure with room inside for an expansion card and additional connectors allowing for more customization.
The beauty of the Monitor One system is that you can control everything from the Console. Even after the system has been deployed, you can remotely change the sleep interval, monitor the sensor data, or track the device’s vitals.
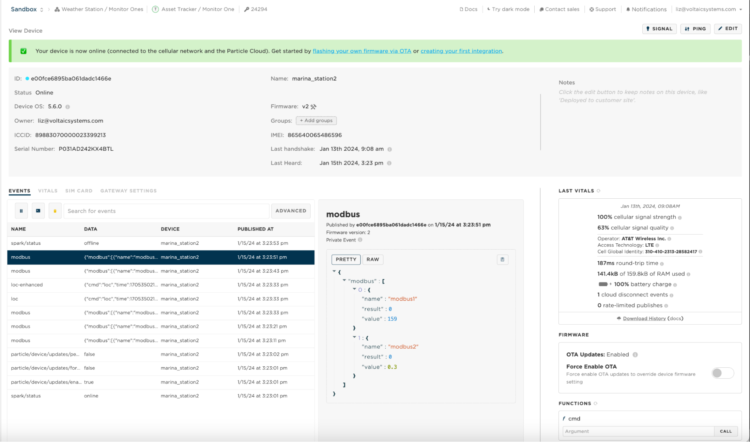
Particle Console Events
Thanks to the Harbor School on Governors Island for agreeing to host the system on their pier.
In this post, we’ll cover:
- Getting started with Particle’s Monitor One
- An introduction to RS485
- Measuring and monitoring the external battery voltage
- Enabling sleep to make the device more efficient
- Deploying the system with appropriately sized solar panel and battery
- Publishing the data to the dashboard
Background on Tide Monitoring
From April-October, I can be found sailing in New York Harbor with the One°15 sail club. To help navigate the waters and strategize for Wednesday night racing, I use several apps to monitor the wind and tides, so why not create one more? This exercise also gives me a chance to see how my device might align with commercial applications.
If you’re looking for complete products, there are a number of established companies that have water level monitoring solutions including: Hohonu, Divirod and Greenstream.
This was how we imagined the deployment before visiting the site:
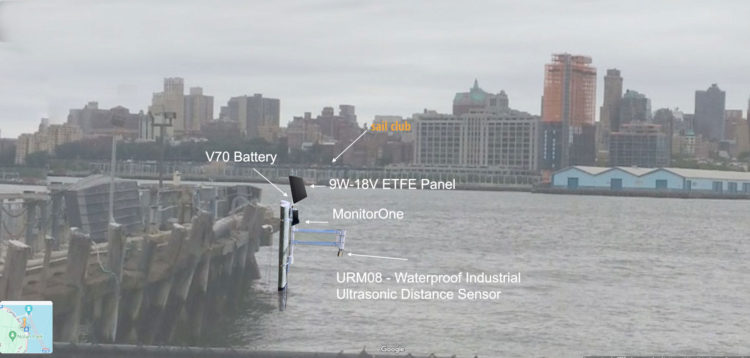
Original POC
And, this was how we actually deployed the device:
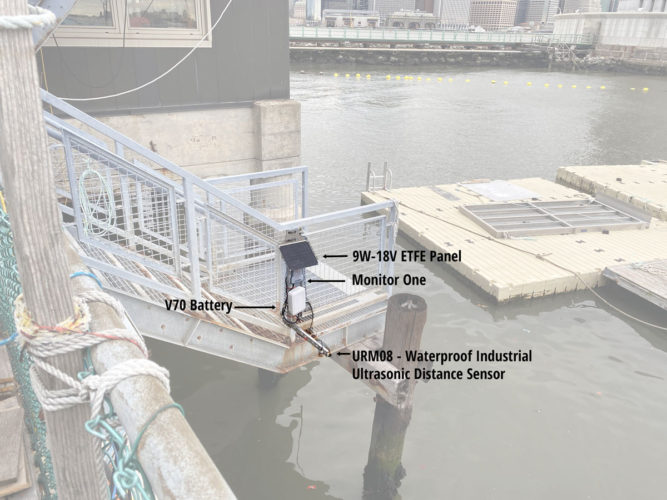
Actual Deployment
Parts Needed for Tide Monitoring
- Particle Monitor One
- URM08 – Waterproof Industrial Ultrasonic Distance Sensor (35~550cm, ModBus-RTU)
- Two 5.6KΩ resistors
- V70
- 9W-18V ETFE Panel
- Extension with Leads – Molex Extension
- 3.5×1.1mm Extension Cable – 4 Foot
- PG 13.5 Cable Glands
- Medium Solar Ready Enclosure
- Solar Panel Bracket – Medium
- Drill
- Wires
- Optional:
- Optional:
- Lever Wire Nuts Connectors Kit
- SparkFun USB to RS-485 Converter
- Arduino Uno
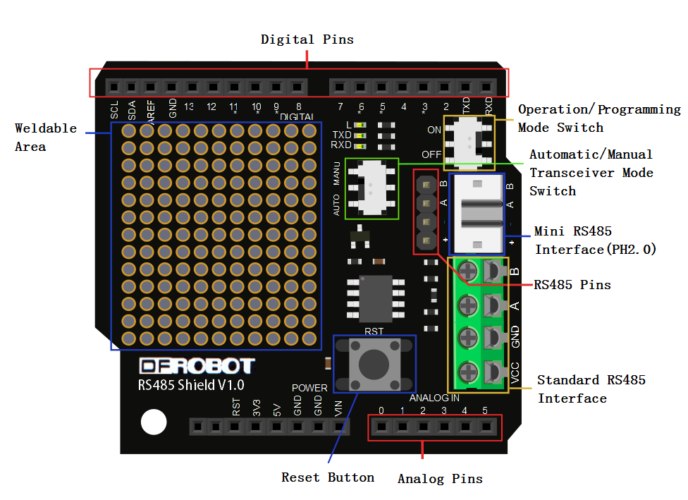
- RS485 Shield
- Software
- CoolTerm
- Modbus RTU Master
- CoolTerm
- Lever Wire Nuts Connectors Kit
Software Requirements
- Visual studio code
- Particle workbench installed
- Particle CLI installed (used for the serial logging)
- GitHubclient
- A claimed Monitor One device.
Helpful Documents
The Monitor One
Advantages of the Monitor One
- The console provides a programming-free way to set up your system.
- You can control the system remotely through the console. This means that you can easily change how often the system polls the sensors during development and even after the system is deployed.
- The system uses cellular connectivity so it works anywhere where there is cellular service.
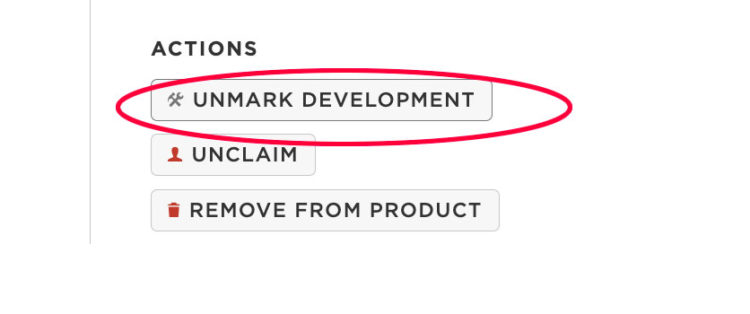
Step 1: Follow the Monitor One Quickstart Guide
In the Console, on the device page, make sure you mark the device as a development device. Once it is marked, you should see this displayed:
Step 2: Set Up the Particle Workbench in Visual Studio Code
Step 3: Gather Your Parts
Step 4: Connect the Sensor
All of our connections to the M1 will use the I/O Card M12 8-pin to flying leads
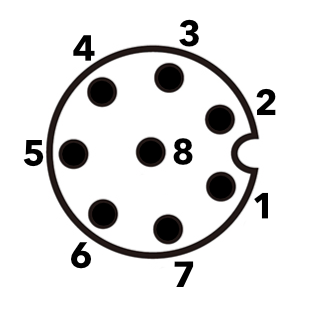
| Conn P1 (M12) | Color | Function/GPIO | Using in our application |
|---|---|---|---|
| 1 | white | CAN_P | No |
| 2 | red | VIN (6-30 VDC) | Yes |
| 3 | green | 4-20mA input
A7 |
No |
| 4 | yellow | 0-10V input
A6 |
Yes |
| 5 | gray | RS485_B (N) | Yes |
| 6 | pink | RS485_A (P) | Yes |
| 7 | blue | CAN_N | No |
| 8 | black | GND | Yes |
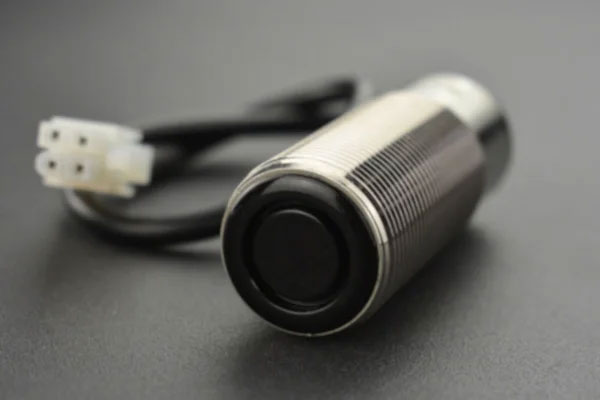
Ultrasonic sensor
This is the detection area of the sensor. While the max distance is 550 cm, you also need to be about a meter away from obstructions.
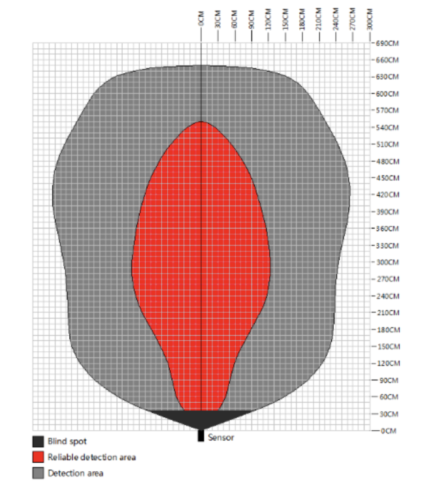
Sensor’s Detection Area
The URM08 – Waterproof Industrial Ultrasonic Distance Sensor employs an RS485 communication interface and supports the Modbus protocol.
RS-485 is a robust standard for serial communication. It defines the electrical characteristics of the data and how it is physically transmitted through a network.
Modbus, on the other hand, is a communication protocol that defines a message structure independent of network type. It is one of the most widely used protocols in the industrial sector, particularly for connecting electronic equipment.
Modbus and RS-485 are often used in industrial communication systems where the Modbus protocol can be implemented over an RS-485 network. In a typical setup, Modbus commands are sent over RS-485 to a device where the command is processed and returns a response. Modbus defines how the data is structured and processed, while RS-485 defines how the data is physically transmitted between devices.
The URM08 – Waterproof Industrial Ultrasonic Distance Sensor (35~550cm, ModBus-RTU) uses Modbus RTU.
Modbus RTU is an implementation of Modbus that transmits data in binary format and uses a simple 16-bit structure with a Cyclic Redundancy Checksum (CRC), 8-bit bytes, one bit at a time, at a baud rate ranging from 1200 bps to 115200 bps. RTU values are encoded as standard big-endian binary where the Most Significant Byte (MSB) is encoded before the Least Significant byte (LSB).
Each exchange of data consists of a request from the controller, in our case, the M1, followed by a response from the worker (the sensor). Each data packet, whether request or response, begins with the device address or worker’s address, followed by function code, and then by parameters defining what is being asked for or provided.
Each request is broken down like this:
- Device Address
- Function Code
- Register Number
- Register Count
- Data
- Checksum
For more information about the Modbus RTU Protocol , see this Unserver guide or this IPC2U guide.
When connecting the M1 to the sensor you want to connect the sensor’s red wire black wires to a battery, the green wire to the M1’s RS485-N, and the yellow wire to the M1’s RS485-P.
| M1 | URM08 (SEN0246) |
|---|---|
| RS485_N (Gray) | M1 RS485-B (Yellow) |
| RS485_P (Pink) | RS485-A (Green) |
| VIN (Red) Do not power from M1 supply! | |
| GND (Black) | GND (Black) |
Because the URM08 requires 6V-12V, you must initially power it separately from the M1. While setting up your system and connected to the M1’s AC charger, the VIN will receive 24V and will damage your sensor.
Step 5: Connecting the M1 to your computer
Open the M1 and connect a micro USB cable between it and your computer.
Step 6: Clone the Firmware
Cloning the firmware will create a local copy of the official version so that you can modify it with the custom functions.
Download the M1’s official firmware to a folder on your desktop.
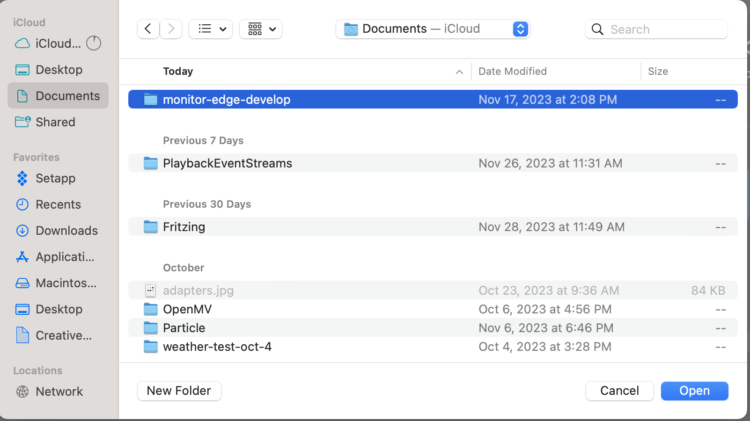
Step 7: Open the folder from the Particle Workbench
In VSCode go to File → Open folder and select/open the downloaded folder:
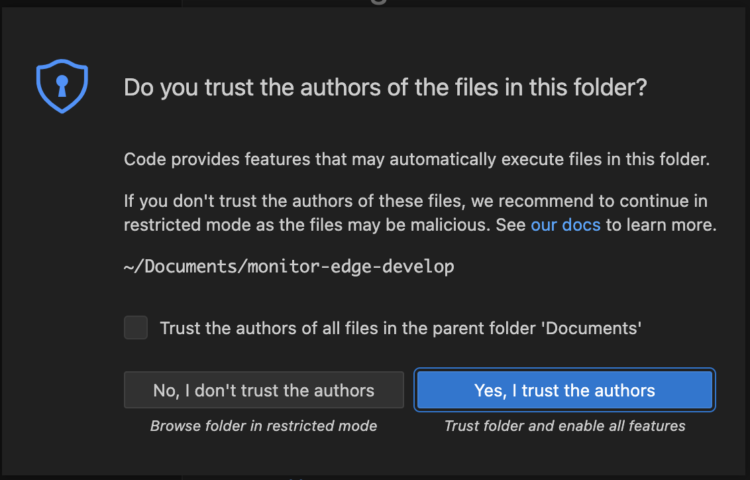
Click on Yes, I trust the authors:
Step 8: Modify the code
-
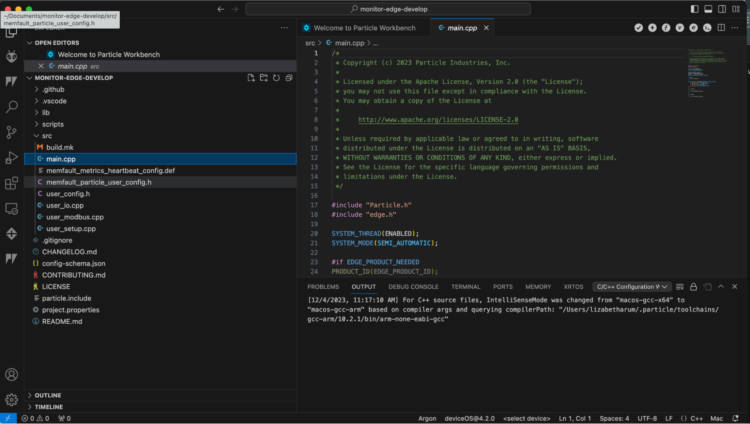
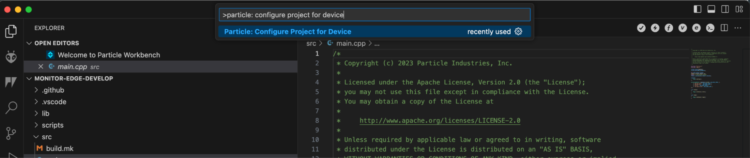
- In the Explore panel, open main.cpp:
- In the top search bar run the command:
>particle: configure project for device
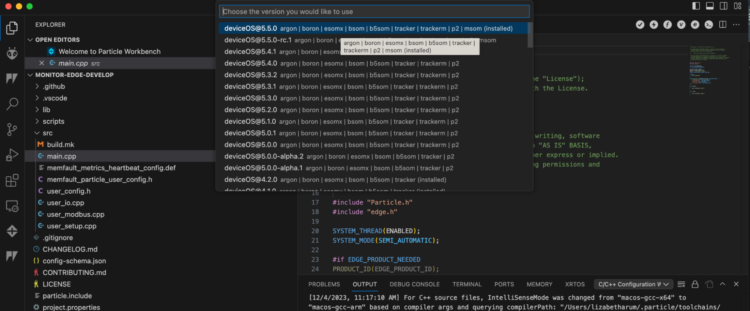
- Choose device OS@5.5.0 (or the latest version):
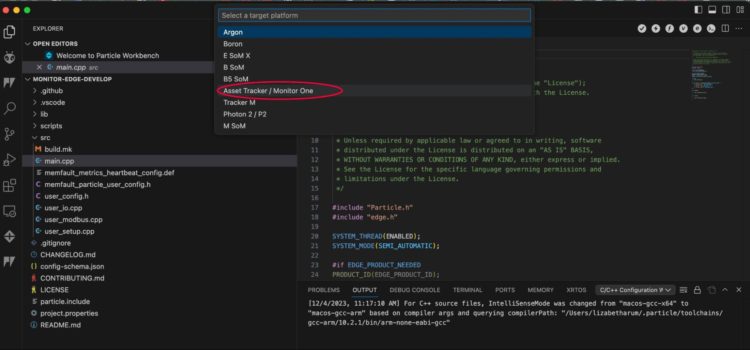
- Choose Asset Tracker / Monitor One:
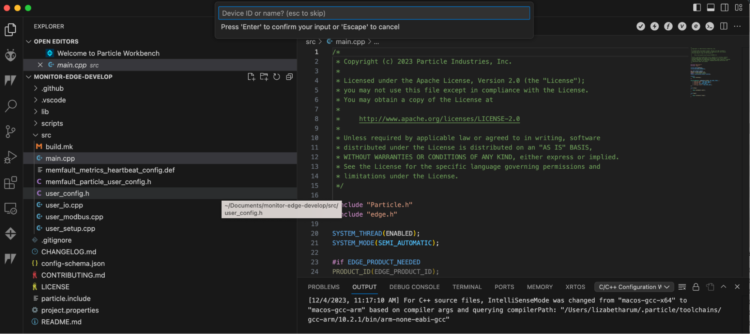
- Click esc when asked for a device name:
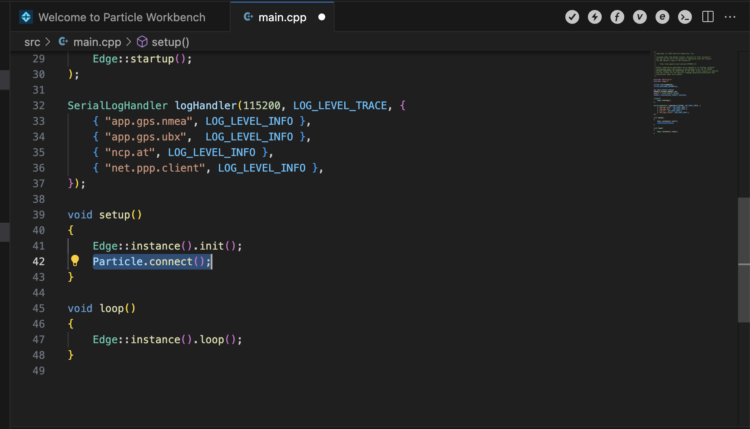
- We’re ready to add a line of code. This example is configured in SEMI_AUTOMATIC mode, so we need to add a
Particle.connect()at the end of thesetup()function:
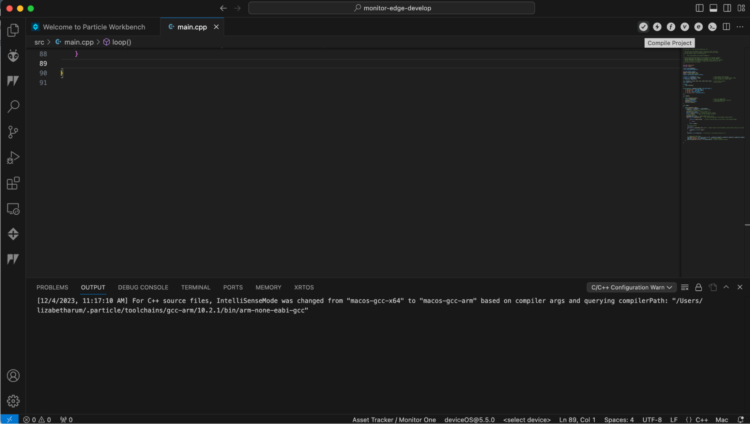
Step 9: Compile the code
Click on the the check mark in the upper right to compile your code:
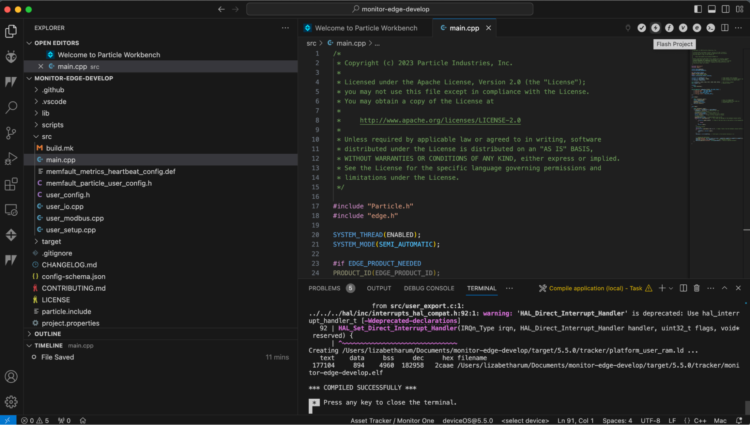
Step 10: Flash the M1:
When the compiler finishes, click on the lightning bolt in the upper right hand corner to flash the M1:
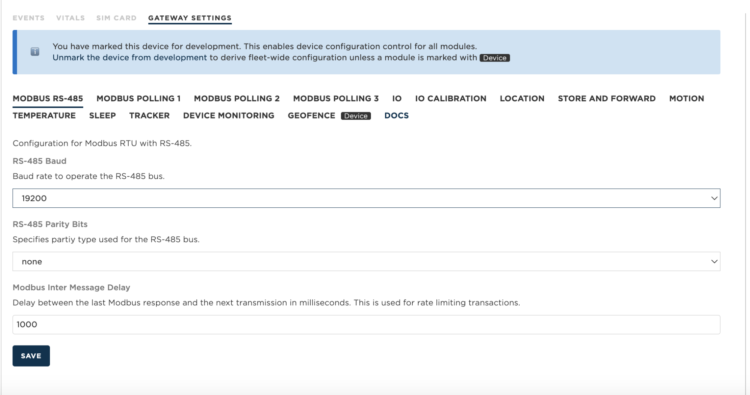
Step 11: Using the Console to Enable Modbus Settings
Return to the Particle Console.
Make sure that you set the baud rate to 19200 under the Modbus RS-485 setting in Gateway Settings and click Save:
Step 12: Set up Modbus Polling 1
To get the distance value you would think you would consult the sensor’s Product Wiki, but in this case you’d be mistaken. We’ll look for the command to read the distance, but what we’ll find is not what we expect:
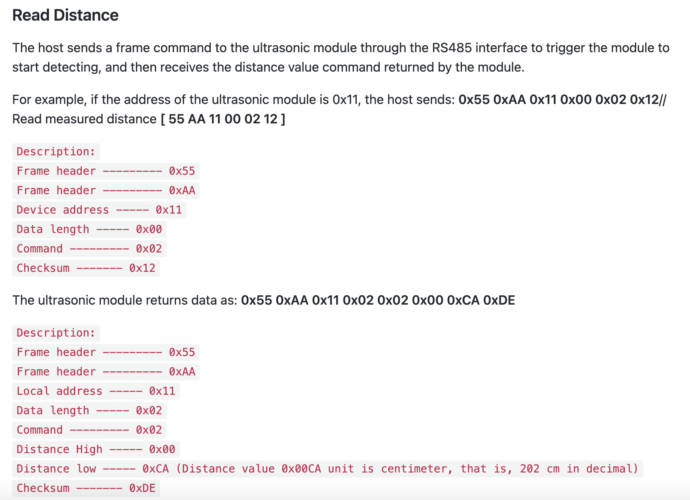
This particular sensor is described as using Modbus RTU, but the information provided in its wiki contradicts this. The SEN0246 sensor datasheet provides a set of specific commands for operations like reading distance and temperature, setting the address, and setting the baud rate. These commands are designed to communicate with the sensor’s firmware and are unique to this particular model. They follow a format that includes a frame header, device address, data length, command, data (if any), and checksum.
This format is different from standard Modbus RTU commands, which typically consist of a device address, function code, data (such as register addresses and values), and a checksum. In Modbus RTU, common function codes include reading and writing to discrete inputs/outputs and holding/input registers.
A Modbus RTU command to read the analog input from a holding register would follow this format:
BYTE REQUEST BYTE ANSWER (Hex) Field name (Hex) Field name 11 Device address 11 Device address 03 Functional code 03 Functional code 00 Address of the first register Hi bytes 06 Number of bytes more 01 Address of the first register Lo bytes AE Register value Hi #40108 00 Number of registers Hi bytes 41 Register value Lo #40108 00 Number of registers Lo bytes 56 Register value Hi #40109 5A Checksum CRC 52 Register value Lo #40109 D7 Checksum CRC 43 Register value Hi #40110 The command looks like this:
11 03 00 01 00 D7 5A, but our documentation provides different commands, ones that do not begin with the device’s ID.The truth is, I actually didn’t figure out how to use this sensor on my own. The very helpful Alberto Sanchez from the Particle team, with a bit of research on his part, came to my aid:
While using the non-standard protocol (the one in the datasheet), the address is 0x02. But for using Modbus standard protocol, the address for the distance is 0x01. That is something not listed on the specs. I found it on a forum, tested it and it worked on my device. https://www.dfrobot.com/forum/topic/312312
What we do need from the datasheet is the device ID.
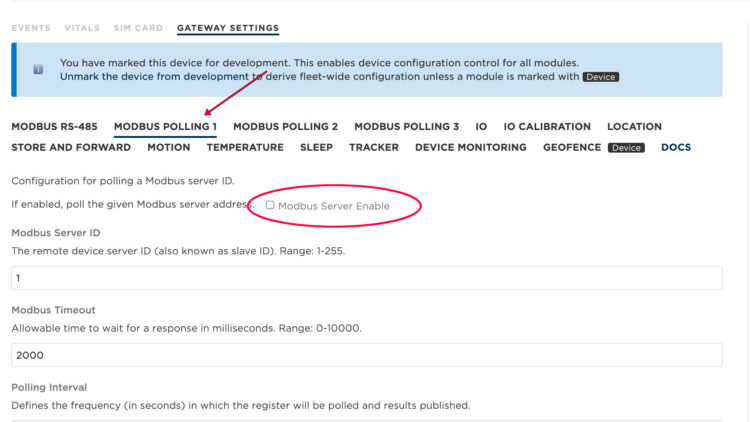
- Enable Modbus Polling 1. It is disabled as the default:
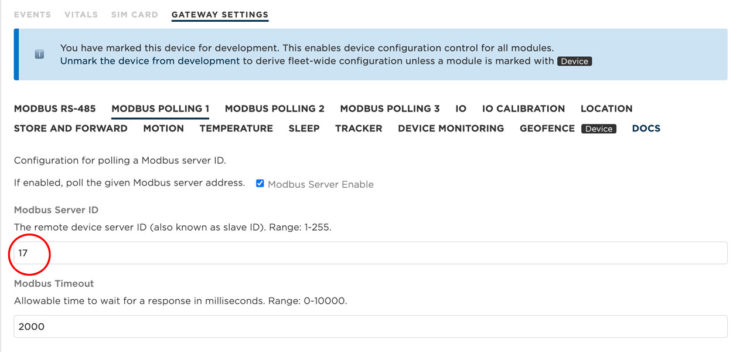
- Set the Modbus Server ID to 17. The ID for the sensor is Hex 11, which is Decimal 17:
- Set the following and then press Save:
- Polling Interval to15. This will be good for testing. When all has been tested, you’ll set this to a different interval.
- Publish polled value to always
- Modbus Function to holding_register (This is associated with the functional code hex value 0x03)
- Register Address to 1 (0x01)
- Modbus data type to unit16
- Mask value to 65535
- Shift Value to 0
- Offset Value to 0
- Scaling Value to 0
- Polling Interval to15. This will be good for testing. When all has been tested, you’ll set this to a different interval.
- Click Save.
- Click on Events and wait until you start to see your modbus values.
- Enable Modbus Polling 2.
- Set the Modbus Server ID to 17.
- Set the following and then press Save:
- Polling Interval to 15. This will be good for testing. When all has been tested, you’ll set this to a greater interval.
- Publish polled value to always
- Modbus Function to holding_register (This is associated with the functional code hex value 0x03)
- Register Address to 2 (0x02)
- Modbus data type to unit16
- Mask value to 65535
- Shift Value to 0
- Offset Value to 0
- Scaling Value to 0.1
- Polling Interval to 15. This will be good for testing. When all has been tested, you’ll set this to a greater interval.
Step 13: Troubleshooting
If your Modbus result is 226, you have a communication error with your sensor. Check the wiring, especially between power and GND. If you still get 226 you could have:
- The wrong baud rate
- The wrong Modbus Server ID
- The wrong Register Address (remember to convert your Hex value to decimal)
If your result is 224. You have power, but your A and B lines are not connected properly. Check your wiring.
You can connect a USB to RS485 converter to the circuit and then use a serial program to monitor the Modbus commands from the M1. I used CoolTerm for the Mac and ModbusRTUMaster (not simultaneously) to monitor the transmissions.
Step 14: Characterize Power Consumption
- To turn off/disconnect the internal battery enter the shipping mode command in the console. Shipping mode allows the device to be shipped in a way that the battery does not discharge. Note that you can only get out of shipping mode by connecting the device to USB power or power by the M8 connector.
{"cmd":"enter_shipping"}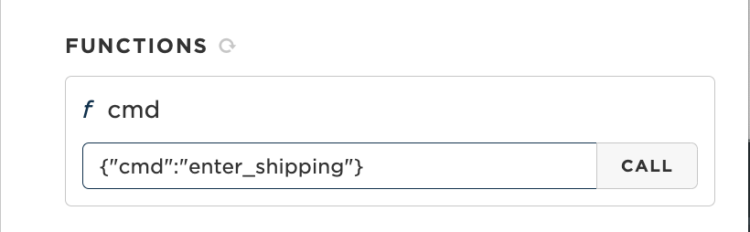
- I connected my power and GND lines to a programmable power supply and collected the following data:
- When not sending data I measured 20mA.
- When actively sensing and sending data, I measured 110mA.
The system takes less than 10 seconds to transmit data, so if I sent data every thirty minutes
Sleeping: 0.02 A * 12 V* 24*(86376/86400)(Proportion per Day )= 5.75840 Wh
Awake: 0.11 A * 12 V * 24* (24/86400)(Proportion per Day )=0.01760 Wh
Total=5.77 Wh per day
To determine which panel and battery I need, I considered the following information:
- Daily Energy Consumption=5.77 Wh per day
- Average Sunlight Hours=The average sunlight hours in New York City (NYC) in December are typically about 4 to 5 hours of effective sunlight per day.
- Solar Panel: If we select the 9 Watt 18 Volt Solar Panel we know that in December we will be able to charge the battery for 4 hours a day.
- Battery: We need a battery that can store enough energy to run the device for days when sunlight might be insufficient. The V70 outputs 12V and has a capacity of 71 Watt Hours.
71/5.77=12.305
- When not sending data I measured 20mA.
The V70 Battery with a 9W-18V ETFE Panel can theoretically run indefinitely under normal conditions with sufficient daily sunlight. The battery alone provides around 12 days of backup power without solar charging, and this duration extends with partial solar charging on less sunny days.
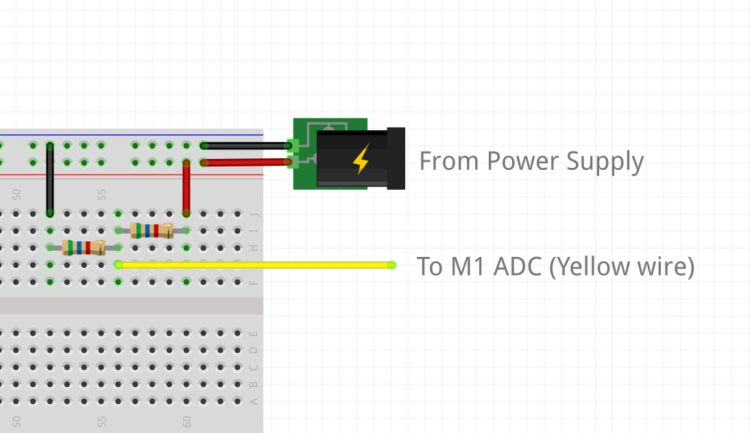
Step 15: Adding a Voltage Divider Circuit
And, of course we want to measure our battery voltage to understand how our system is performing, but how do we connect a voltage divider to the Monitor One? Once again, Alberto from Particle provided the answer:
- We need to use two 5.6KOhm resistors to scale down our 12 Volts:
- Back in the Console, select the IO setting:
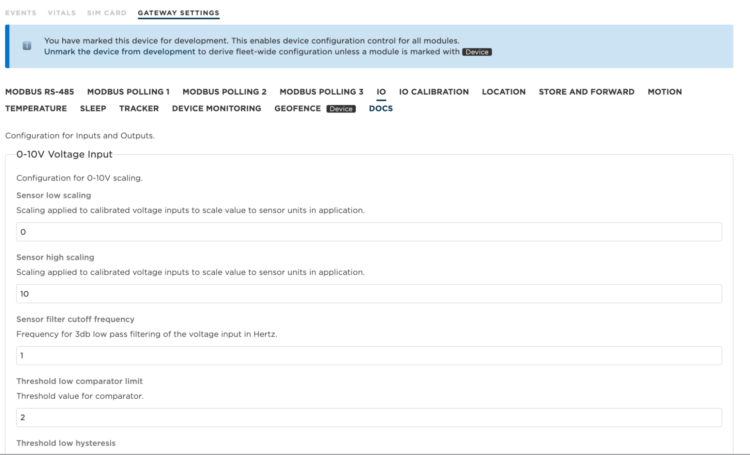
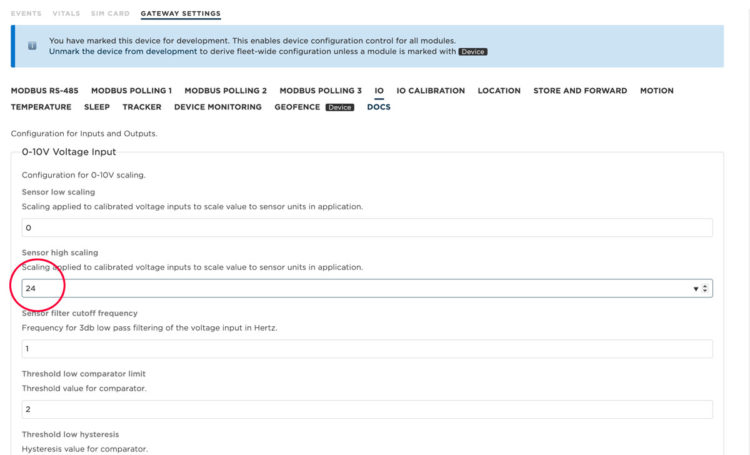
- By default, the scaling is 0-10V, but we can scale down 12V to half, and then multiply the maximum value by 2. To do this, change the sensor high setting from 10 to 24:
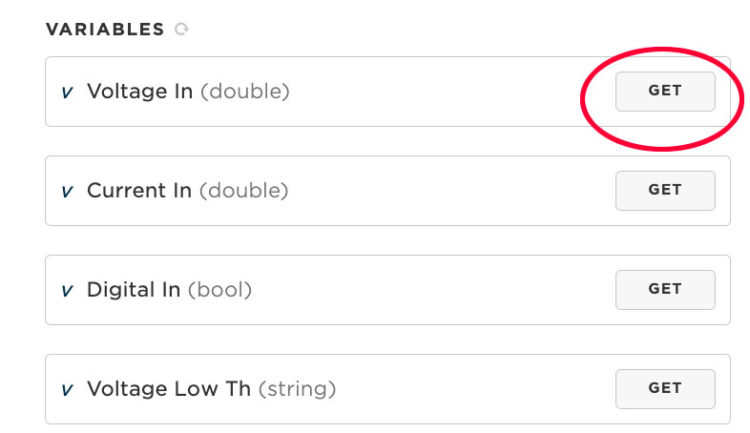
- Save your settings and you’ll see the measurement included in the location (loc) event as io_v
- You don’t need to wait for the location event to check your scaling or calibrations, you can get the value instantly, as long as the device is not in sleep mode. Just look at the Voltage In variable on the right pane and click GET:
Step 16: Putting the Board to Sleep
Sleep Mode can be set to enable or disable in the Console.
Post Publish Execution Time is the minimum duration in seconds to stay awake after publishing before going to sleep. The default is 10 seconds. This provides enough time to make sure a software update can be started when waking up from sleep. If a software update starts, the device will automatically stay awake until the update completes.
Maximum Connecting Time is the maximum duration, in seconds, to wait for being cellular-connected and to obtain a GNSS lock before publishing. If connecting takes too long, then the device will go back to sleep instead of continuously attempting to connect. The default is 90 seconds.
Here are best practices from Particle regarding sleep:
- If you are sleeping for less than 10 seconds, you shouldn’t use sleep at all, and instead just stay awake.
- If you are sleeping less than 10 minutes, you should never use a cellular off mode because frequently reconnecting to cellular may use more power than it saves, and also your SIM may be banned from the cellular network for aggressive reconnection.
- If you are sleeping more than 15 minutes, using cellular off mode uses the least power.
- From 10 to 15 minutes, using cellular standby or cellular off is a toss-up, and will depend on other factors.
To enable sleep I consulted again with Alberto:
- Make sure that Modbus polling settings use a Polling interval less than the value used in the Post Publish Execution Time on the sleep settings.
- I set each of my Modbus Polling Intervals to 10 seconds.
- I set the Post Publish Execution Time in Sleep to 40 and the Maximum Connection Time to 90 seconds.
And here is where the magic happens: I set my Minimum location update frequency to be my desired interval. In this case, every 20 minutes, or specifically 2100 seconds. And then I set my Maximum location update frequency to a number less than the minimum. In my case, I set it to 600.
With these settings, the device will wake up to post the location data every 2100 seconds. When it wakes, the Monitor One will stay on for at least 40 seconds, allowing the Modbus to be polled and published a couple of times.
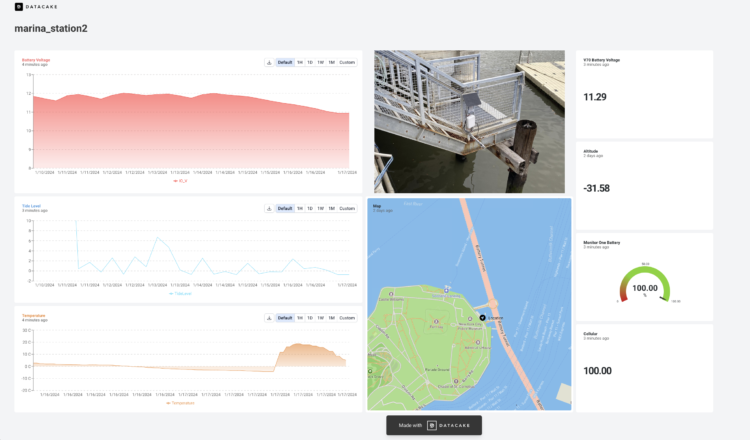
Step 18: Connecting to a Dashboard
For this project I connected the Monitor One to a Datacake dashboard. Datacake is a cloud-based platform offering tools for building custom IoT applications and dashboards.
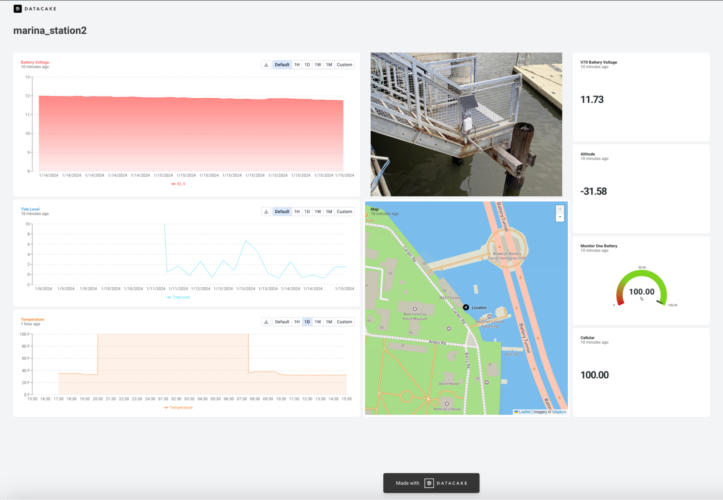
To set up the dashboard, I followed this Datacake tutorial
And here is the payload decoder:
/*
Datacake Template for Particle.io Asset Tracker One
Author: derived from Simon Kemper
Version: 0.2
(c) Datacake GmbH
*/
function calculateDistance(lat1, lon1, lat2, lon2) {
    Number.prototype.toRad = function() {
        return this * Math.PI / 180;
    }
    var R = 6371; // km
    var dLat = (lat2-lat1).toRad();
    var dLon = (lon2-lon1).toRad();
    var a = Math.sin(dLat/2) * Math.sin(dLat/2) +
    Math.cos(lat1.toRad()) * Math.cos(lat2.toRad()) *
    Math.sin(dLon/2) * Math.sin(dLon/2);
    var c = 2 * Math.atan2(Math.sqrt(a), Math.sqrt(1-a));
    var d = R * c;
    return d;
}
function calculateF(celsius){
 return (9*celsius)/5+32;
}
function map_range(value, low1, high1, low2, high2){
return low2 + (high2 - low2) * (value - low1) / (high1 - low1);

}
function calculateSlope(x1, y1, x2, y2) {
    return (y2 - y1) / (x2 - x1);
}
function calculateIntercept(x, y, slope) {
    return y - slope * x;
}
// Data points
const x1 = 164, y1 = -0.9;
const x2 = 86, y2 = 5.2;
// Calculate slope and intercept
const slope = calculateSlope(x1, y1, x2, y2);
const intercept = calculateIntercept(x1, y1, slope);
function convertCmToTideLevel(cm) {
    return slope * cm + intercept;
}
function Decoder(payload, event) {
    var decoded = {};
    if (event == "loc") {
        payload = JSON.parse(payload);
        if (payload.cmd == "loc") {
            if ("batt" in payload.loc) decoded.battery = payload.loc.batt;
            if ("cell" in payload.loc) decoded.cellular = payload.loc.cell;
            if ("speed" in payload.loc) decoded.speed = payload.loc.speed;
            if ("alt" in payload.loc) decoded.altitude = payload.loc.alt;
            if ("lck" in payload.loc) decoded.has_fix = payload.loc.lck ? true : false;
            if ("temp" in payload.loc) decoded.temperature = payload.loc.temp;
            if ("io_v" in payload.loc) decoded.io_v = payload.loc.io_v;

            // Decode Location and check for valid data

            if (("lat" in payload.loc) && (decoded.has_fix) && (payload.loc.lon != 0) && (payload.loc.lat != 0)) {

                // Store new Location in Dictionary for Datacake Fields

                decoded.location = "(" + payload.loc.lat + "," + payload.loc.lon + ")";

                /* --- Experimental - Geofencing and Distance Covered Detection --- */

                // Calculate Relative + Total Distance covered

                // Check if we already have a location stored (skip otherwise)

                try {
                    if (measurements.LOCATION.value != 0) {

                        // get old position from Datacake Database

                        var oldLocation = measurements.LOCATION.value.replace("(","").replace(")","").split(",");
                        var oldLat = parseFloat(oldLocation[0]);
                        var oldLong = parseFloat(oldLocation[1]);
                        var newLat = payload.loc.lat;
                        var newLong = payload.loc.lon;

                        // get old distance from Datacake

                        var oldDistance = measurements.DISTANCE.value;

                        // Calculate new distance

                        var newDistance = calculateDistance(oldLat, oldLong, newLat, newLong);

                        // Distance is stored in a Counter-Field. These need absolute values.
                        // Counter fields can be used to show relative changes and relative values over time period

                        decoded.distance = oldDistance + newDistance;

                        // Geofencing - Distance from Homezone

                        try {
                            if (measurements.GEOFENCE_HOMEZONE_LOCATION.value != 0) {

                                var homezoneLocation = measurements.GEOFENCE_HOMEZONE_LOCATION.value.replace("(","").replace(")","").split(",");
                                var homezoneLat = parseFloat(homezoneLocation[0]);
                                var homezoneLong = parseFloat(homezoneLocation[1]);

                                decoded.geofence_distance_from_homezone = calculateDistance(homezoneLat, homezoneLong, newLat, newLong);

                            }
                        } catch (e) {
                            console.log("no homezone set");
                        }


                    }
                } catch (e) {
                    console.log("catched no value on history");
                }

            }

        }

    } else if (event == "spark/device/diagnostics/update") {

        payload = JSON.parse(payload);

        decoded.cellular_radio_access_technology = payload.device.network.cellular.radio_access_technology;
        decoded.cellular_operator = payload.device.network.cellular.operator;

    } else if (event == "spark/status") {

        if (payload == "online") {

            decoded.online_status = true;

        } else {

            decoded.online_status = false;
        }
    } else if (event == "modbus") {

        payload = JSON.parse(payload);
if (payload.modbus[0].name == "modbus2"){
            decoded.Temp = calculateF(payload.modbus[0].value);

        }
        else if (payload.modbus[0].name == "modbus1"){
            decoded.TideLevel=convertCmToTideLevel(payload.modbus[0].value);
        }

    }
    // Array where we store the fields that are being sent to Datacake
    var datacakeFields = []

    // take each field from decoded and convert them to Datacake format
    for (var key in decoded) {
        if (decoded.hasOwnProperty(key)) {
            datacakeFields.push({field: key.toUpperCase(), value: decoded[key]})
        }
    }

    // forward data to Datacake
    return datacakeFields;
}
Step 17: Deploying
On a very windy recent January afternoon, Jeff Crystal and I ferried over to Governors Island. Once there, we met with Dorick Lee’s Harbor School HS class to talk about the project and how we could in turn help them add solar to their own water-related spring physical computing projects.
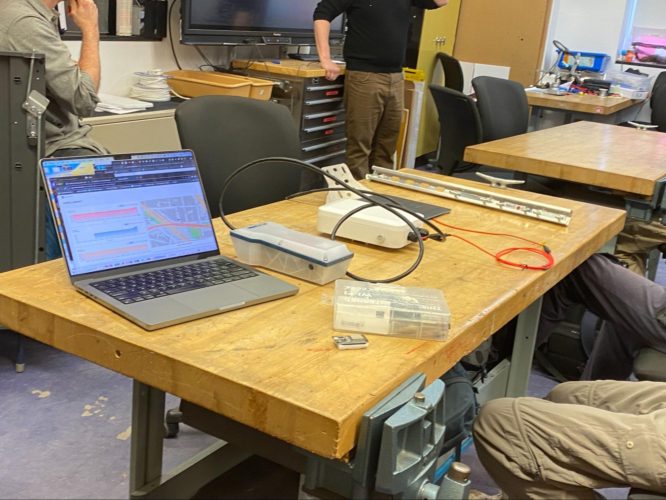
The parts of our system laid out on the table before installation
After speaking with the students, we made our first attempt at installation. In the first iteration we found that our Ultrasonic device was over a pair of cables instead of water:
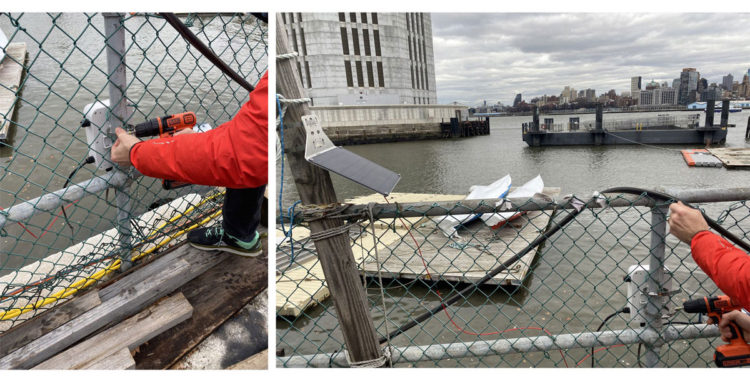
First attempt at installing
Final installation
Fortunately, we were able to quickly scout out a better location and in short order uninstalled and reinstalled the system:
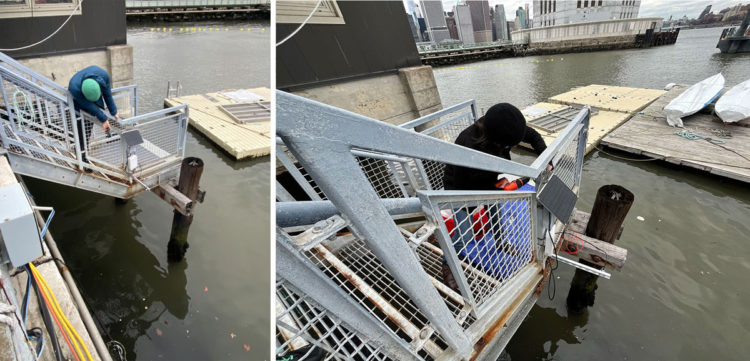
The lesson learned here was if at all possible, visit the location before deploying your system. We were lucky that we brought multiple zip ties, hose clamps, u bolts, nuts, and a cordless drill. Being prepared allowed us to quickly pivot from one location to another.
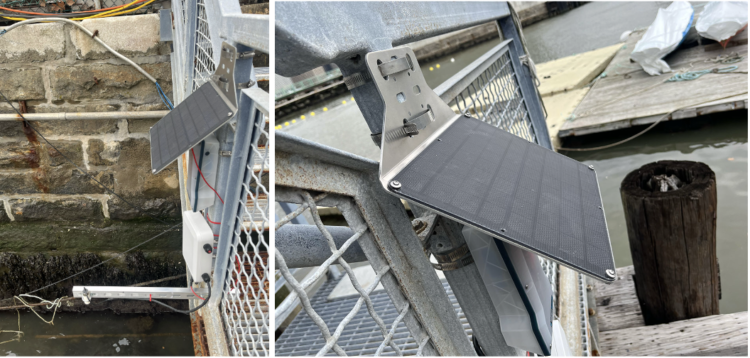
Installed
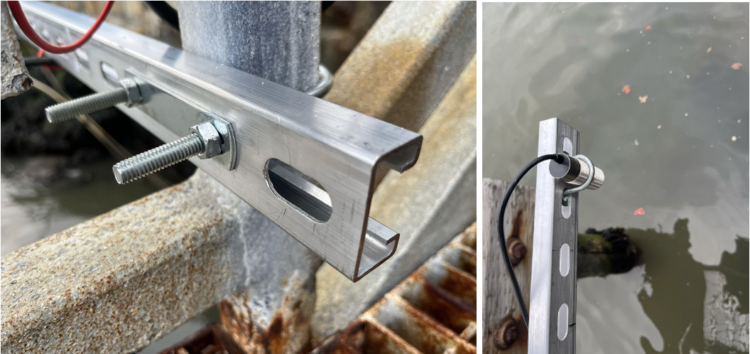
Using unistruts and u bolts
Next steps
Next steps could be adding another sensor or designing an entirely different configuration.
Adding Another Sensor
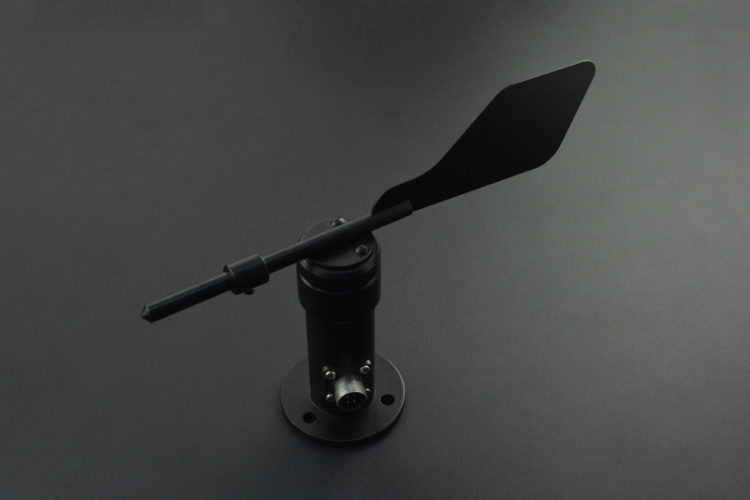
Wind Vane
I really wanted to add a wind vane to the project, but this would require a different solar system set up.
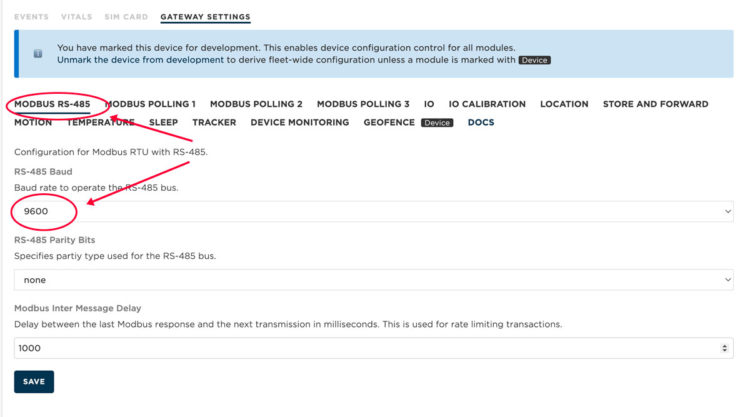
The default baud rates for the wind vane and the ultrasonic sensors are different. While the default rate for the ultrasonic sensor is 19200, the wind vane is 9600. Fortunately, the ultrasonic sensor can also work at 9600, but we do need to set it.
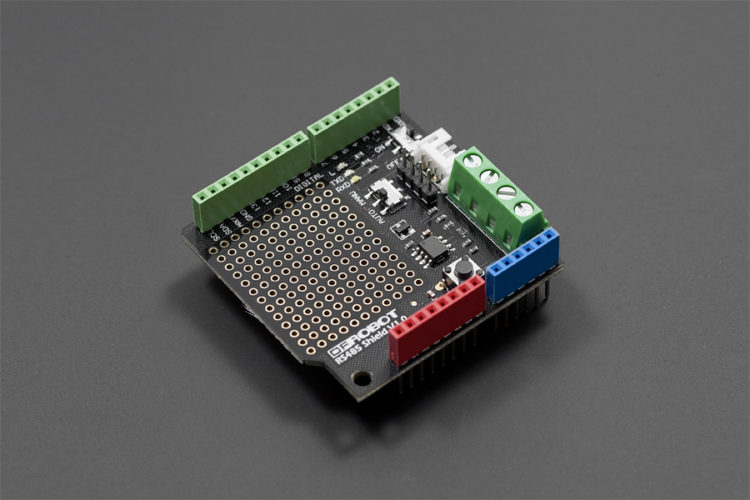
Arduino RS485 Shield
Changing the baud rate of the ultrasonic sensor was a bit challenging. After failing to change the speed using CoolTerm, Serial, or modbusRTUMaster, I ended up attaching the sensor to an Arduino Uno with aRS485 Shield.
To change the baud rate from the default, I ran this simple program that used the command from the product wiki and a checksum that I got from this online checksum calculator that Particle’s Alberto recommended:
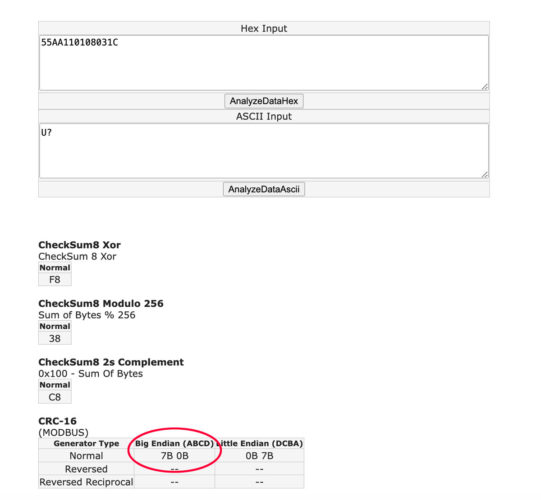
unsigned char i=0;
//command to change baud rate to 9600
unsigned char CMD[9]={0x55,0xAA,0x11,0x01,0x08,0x03,0x1C,0x7B, 0x0B}; //
void setup() {
// Serial1.begin(19200);  //Communicate with module via Serial1, set baud rate to 19200
 Serial.begin(19200);   //Set Serial to serial port of data output
}
void loop() {
for(i=0;i<9;i++){
   Serial.write(CMD[i]);
   }
delay(50);  //Wait data to return
i=0;
}
Once the baud rate was changed, you’ll need to reset the baud rate to 9600 in the Console:
Like the ultrasonic sensor, the RS485 Wind Vane Direction Sensor also employs RS485 communication interface and supports the Modbus protocol.
When connecting the M1 to the sensor, connect the sensor’s green wire to RS485-A, and the yellow wire to RS485-B.
M1 URM08 (SEN0246) Wind Vane (SEN0482) RS485_N (Gray) M1 RS485-B (Yellow) RS485-/B/T (Green) RS485_P (Pink) RS485-A (Green) RS485+/A/T+ (Yellow) VIN (Red) Do not power from M1 supply! (Red) Connect to Buck Converter GND (Black) GND (Black) GND (Black) Connect to Buck Converter In order to power the wind vane which requires a minimum of 12V, we’ll need to add a buck converter:
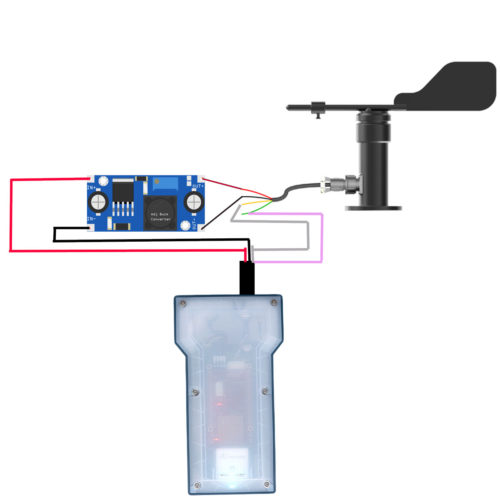
Adjust the XL6009 DC-DC Booster Converter Module to deliver between 12 and 15 V to the wind vane.
In the console we’ll need to enable Modbus Polling 3.
The wind vane follows standard Modbus RTU commands, and the documentation describes how we can monitor wind directions: principle, half-winds, and quarter-winds.
To find the direction, the host (M1) sends a query frame (hexadecimal):
02 03 00 01 00 01 D5 F9(8 bytes)Peripheral Add. Function Code Register Start Add. Length of Register High Bits of Check Code Low Bits of Check Code 1 byte 1 byte 2byt 2byt 1 byte 1 byte 0x02 0x03 0x00 0x01 0x00 0x01 0xD5 0xF9 The peripheral device (the wind vane) responds with this frame (hexadecimal):
02 03 02 00 03 BC 45 (7 bytes)Peripheral Add. Function Code Number of Valid Bytes Data Area High Bits of Check Code Low Bits of Check Code 1 byte 1 byte 1 byte 2 byte 1 byte 1 byte 0×02 0x03 0x02 0x00 0x03 0xBC 0x45 There are 16 directions in total, and a value = 00 03 = 3 corresponds to East-northeast as seen in the table below.
Direction 16 Directions Value 360° North 0 0° – 11.2° North-northeast 1 11.3° – 33.7° Northeast 2 33.8° – 56.2° East-northeast 3 56.3° – 78.7° East 4 78.8° – 101.2° East-southeast 5 101.3° – 123.7° Southeast 6 123.8° – 146.2° South-southeast 7 146.3° – 168.7° South 8 168.8° – 191.2° South-southwest 9 191.3° – 213.7° Southwest 10 213.8° – 236.2° West-southwest 11 236.3° – 258.7° West 12 258.8° – 281.2° West-northwest 13 281.3° – 303.7° Northwest 14 303.8° – 326.2° North-northwest 15 326.3° – 348.7° Setting up the Wind vane in the Console
- Disable Sleep.
- Navigate to Modbus Polling 3.
- Enable Modbus Server Enable.
- Set the following and then press Save:
- Set the Modbus Server ID to 2.
- Polling Interval to 10. This will be good for testing. When all has been tested, you’ll set this to a greater interval.
- Publish polled value to always
- Modbus Function to holding_register (This is associated with the functional code hex value 0x03)
- Register Address to 1 (0x01)
- Modbus data type to unit16
- Mask value to 65535
- Shift Value to 0
- Offset Value to 0
- Scaling Value to 1
- After testing, re-enable sleep.
- Add to the Datacake payload decoder:
function getDirections(num){
    var directions=["North Northeast","Northeast", "East Northeast","East","East Southeast","Southeast","South Southeast","South","South Southwest","Southwest","West Southwest", "West","West Northwest","Northwest","North Northwest","North"];
    return directions[num];
}
- Add this if statement with the other modbus conditionals:
if (payload.modbus[0].name == "modbus3"){
decoded.Wind = getDirections(payload.modbus[0].value);
 }
Adding a second sensor means we’ll need to recharacterize the power consumption.
- Turn off/disconnect the internal battery by entering the shipping mode command in the console.
{"cmd":"enter_shipping"}
- Connect power and GND lines to a programmable power supply and collect the following data. These are the numbers I received:
- When sleeping=0.03A
- When actively sensing and sending data, I measured 0.1A.
The system is awake for 40 seconds while it polls and transmits data, so if I sent data every fifteen minutes
Sleeping: 0.03 A * 12 V* 24*(86304/86400)(Proportion per Day )= 8.63040 Wh
Awake: .11 A * 12 V * 24* (96/86400)(Proportion per Day )=0.03200 Wh
Total=8.66 Wh per day
[CP_CALCULATED_FIELDS id=”11″]
This new system requires a different battery/solar panel configuration. A single 9W panel will no longer be sufficient. One solution could be to use two 9W panels with the V70 battery.
- When sleeping=0.03A
Where am I going to take this project next? The plan is to create a device for a local marina that measures
- Air Temp
- Wind velocity
- Wind direction
- Atmospheric pressure
- Tide height
This system will be useful for boats entering the marina and monitoring the conditions inside the marina.

One °15 Marina
Stay tuned…
- In the Explore panel, open main.cpp:
This is awesome, Lizabeth! Thanks for sharing such a well done and carefully documented project. I’ve been playing around with something similar on a Boron (written up here, but a bit out of date: https://github.com/COAST-Lab/Open-Water-Level/tree/main). Our latest version uses a Voltaic panel as well 🙂
Cheers,
Phil