Voltaic recently collaborated with one of our customers, Hohonu, a company dedicated to real-time water monitoring, and the not-for-profit Brooklyn Bridge Park Corporation, which manages the Brooklyn Bridge Park. The park granted us permission to launch a six month deployment to test a Hohonu tidal gauge. In late July, we installed a gauge on the southwest corner of Pier 3 to capture and share tidal height data with the park and the public. Pier 3 mostly sits below the 100-year-flood line, but was designed by Michael Van Valkenburgh Associates (MVVA) to withstand water inundation.
Background
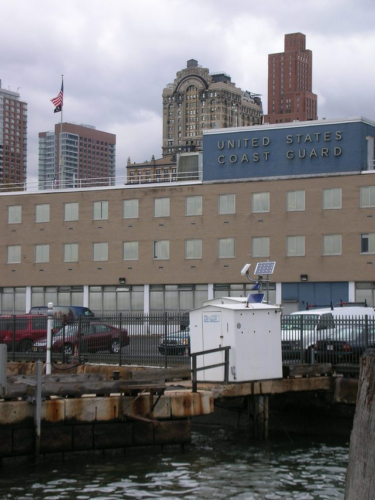
The National Water Level Observation Network (NWLON) maintains a system of 210 long-term, continuously operating water level monitoring stations across the United States and its territories. It is the “go to” source for government and commercial sector navigation, recreation, and coastal ecosystem management. While many coastal towns are far from stations, there is, in fact, a NOAA Water Level Station at the Battery (8518750), just across the East River from the Brooklyn Bridge Park and there is another gauge located on the south side of the Brooklyn Bridge (8517847), on the east edge of the river, at the southwest corner of the park area.
The Battery, NY – Station ID: 8518750
The Brooklyn Bridge gauge collects the following data:
In addition to the data collected above, the Battery station collects Water Levels, Sea Level Trends, Meteorological Observations and is part of PORTS®, a decision support tool that measures and disseminates observations and predictions of water levels, currents, salinity, and meteorological parameters (e.g., winds, atmospheric pressure, air and water temperatures) to help improve mariners safely.
There are certainly other locations in Brooklyn or elsewhere that might benefit from an additional tidal gauge, however, our aim in installing the Hohonu sensor on the Brooklyn side of the East River is to collect hyper-local data. Think of it as being part of a dense sensor network.
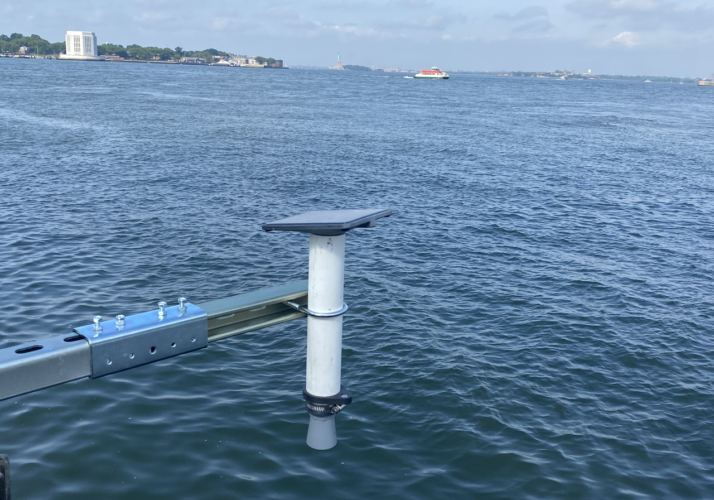
Hohonu gauge installed across harbor from our Monitor One tidal gauge on Governors Island
The Hohonu Sensor
Hohonu’s tide gauges are part of the company’s initiative to monitor water levels and tidal heights and predict flood levels with stormwater run-up in many locations. The devices have an accuracy of +/- 1.5mm, which is crucial for providing precise data for various applications, including academic research, municipal emergency response to aiding in coastal restoration projects, and keeping vessels safe in a marina.
Hohonu gauge installed at the entrance of One 15° Brooklyn Marina
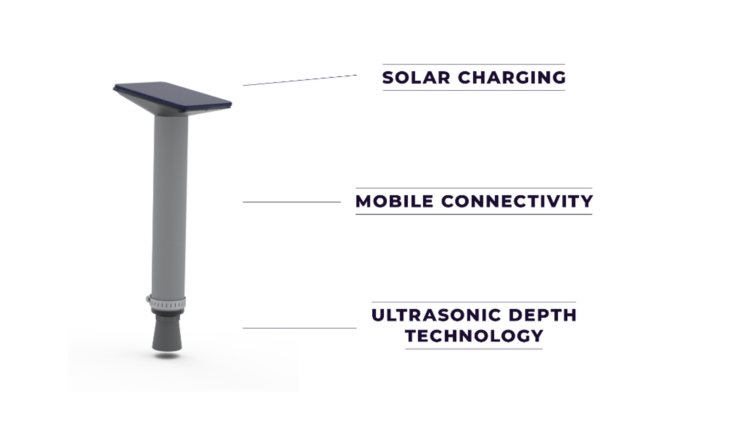
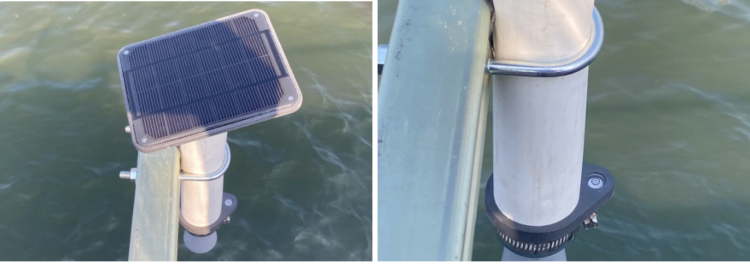
The HTG-PB2 solar-powered gauge is connected through cellular (2G/3G/LTE) and refreshes live data every six minutes. The incorporated small solar panel recharges the battery that powers the sensor, making the system self-sufficient and reduces the need for frequent maintenance.
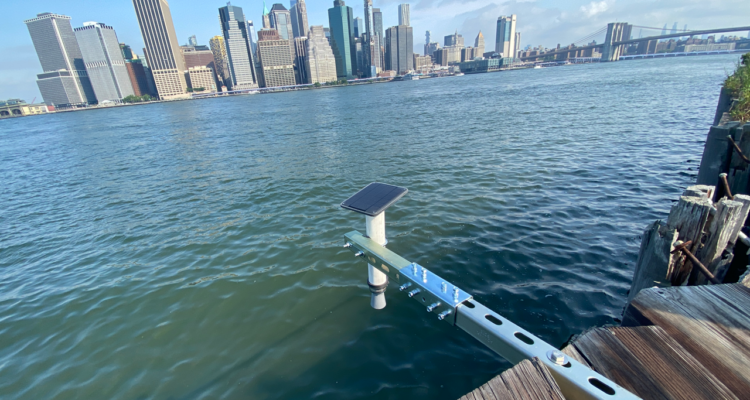
The Hohonu gauge installed over the East River
The tide gauge uses an ultrasonic sensor to measure the distance from a fixed structure above the water to the surface. The sensor emits a sound pulse and then listens for the echo that bounces back from the water surface. The time it takes for the echo to return is used to calculate the distance to the water. The operating range of the sensor is typically between 0.3 to 10 meters, with a resolution of 1 mm. This measurement is known as the “distance to water” (d2w) and is used to infer the water depth by subtracting d2w from the height of the sensor. The tide gauge takes measurements at regular intervals, and the data is averaged to reduce noise and improve accuracy.
Hohonu further ensures the accuracy of their tide gauges over time through a combination of accurate sensor readings, regular data transmission, and adherence to NOAA-consistent methodologies for water level monitoring.
Sharing Data
Hohonu provides several data sharing options, ensuring that users can access the information they need in the way that suits them best.
For general and quick public access to real-time data, Hohonu offers:
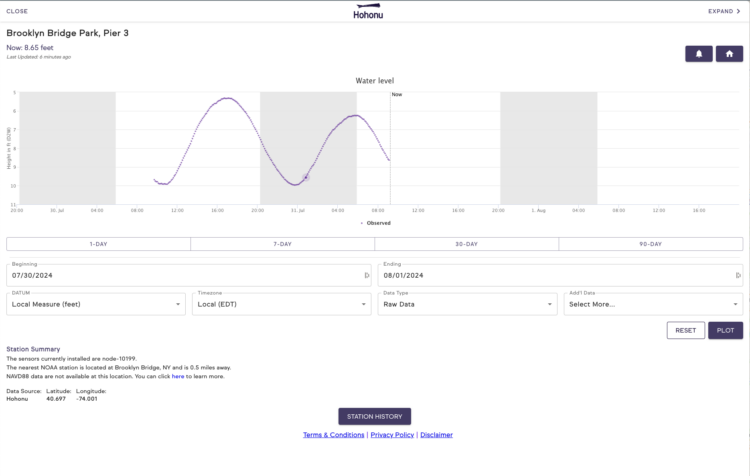
- A Web-Based Dashboard:
- HTML widget to display a live dashboard.
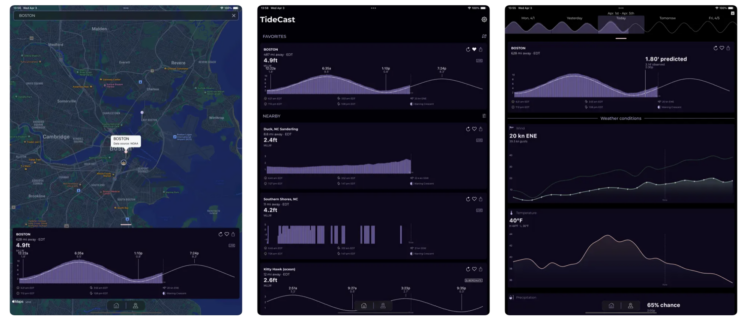
- The TideCast iOS Mobile App:
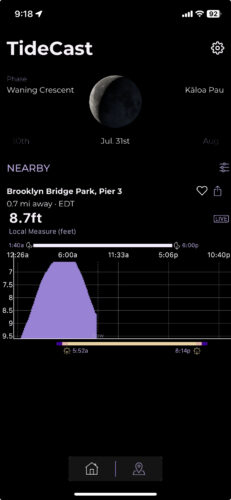
- Live Data – from 400 Hohonu sensors and NOAA stations that refreshes every 6 minutes.
- 72-Hour Water Level Predictions – TideCast’s proprietary prediction algorithm uses machine learning to be up to 80% more accurate than traditional tidal forecasts.
- 12-Month Tidal Predictions: Over 1,500 NOAA locations across the US provide tidal predictions 12 months in advance
- Weather Conditions – view wind, sun and moon phase, temperature, and rain at each station
For advanced public users, data can be shared via:
- CSV Downloads
CSV reports can be downloaded directly from the web-based dashboard
- API Access
Fully-documented API:
For internal stakeholders to monitor the hardware and network performance, there are two ways:
- A Diagnostics viewer
- For validation of hardware performance before installation occurs
- Raw “Distance to water,” battery voltage, cell strength, standard deviation, and other parameters
- Status page
- For monitoring of network performance across each node
- Merging of operational metadata with ongoing performance on a site-by-site basis that is updated hourly
- Permissioned user access to display exclusively the stations that each partner cares most about – while protecting sensitive operational data
- Up-to-date operational plans for each station
Preparing the Sensor
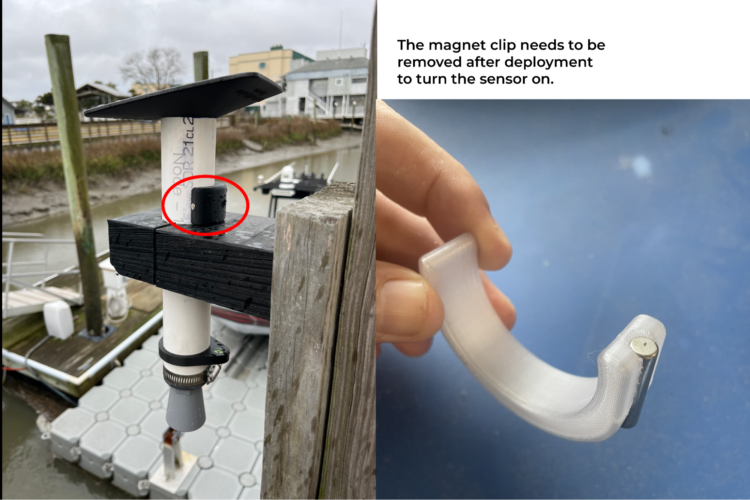
Magnet that ships with sensor
After receiving the sensor from Hohonu, we removed the magnet it ships with and temporarily installed it outside the Voltaic office in full sun in order to fully recharge the battery. This step was necessary as the sensor’s battery had discharged while we stored it indoors for several weeks while we worked out the logistics for installing it (i.e. applying for a permit, selecting mounting hardware, etc.). In total, it took about two days for the sensor to fully recharge.
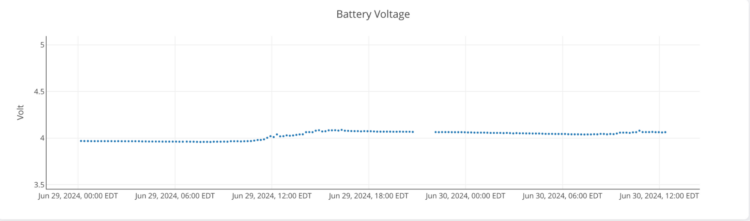
Hohonu provides a handy dashboard which allowed us to monitor the voltage and ensured that the sensor was operational and ready for us to install it in the park.
Installation of Tidal Gauge
When installing the gauge, it is essential to ensure that there is one foot of radial clearance around the sensor. The sensor must also be installed on solid ground. This means no floating docks (which is why we could not install the gauge in the marina).
Best practices call for installing the device level with the surface of the water, as high as possible—at least 1.5 feet above the highest watermark but no higher than 32 feet above the lowest watermark. This height guarantees that the sensor is not affected by the highest tides when providing data for flood prediction.
Deploying the System
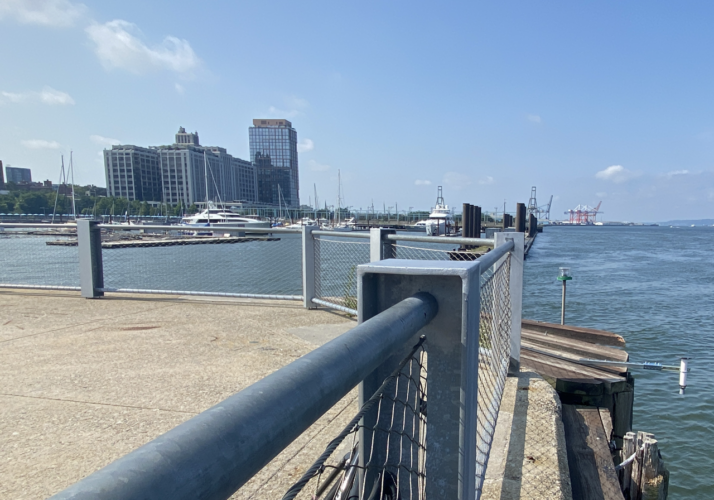
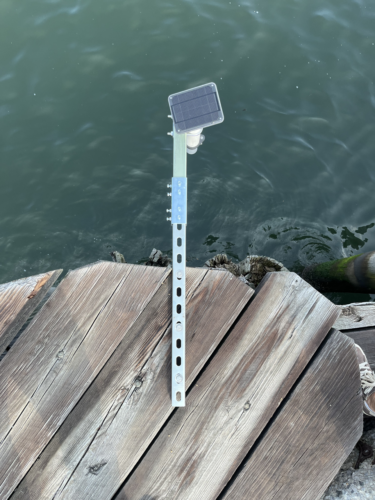
When we spoke to the park about installing the sensor, they suggested Pier 3 as the best location. After scouting the area, we found a spot where the device could meet all the installation requirements, would be easy for us to install, and would allow for facing the panel south (for optimal sun). After receiving the permit, we set about installing the gauge on the southwest corner of Pier 3, at across from the Marina:
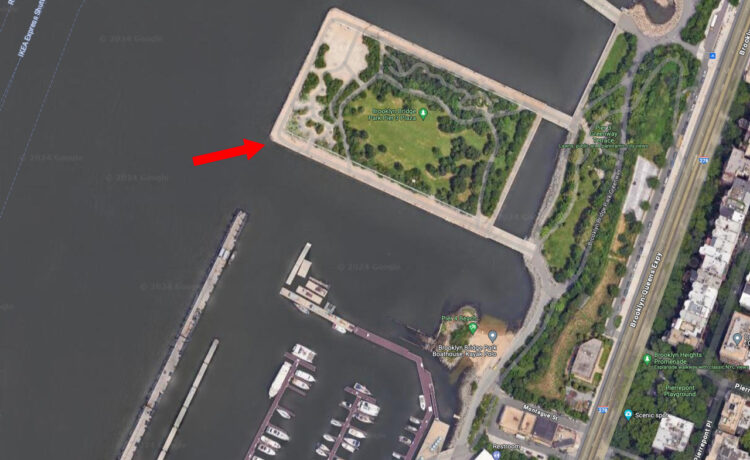
Gauge installed at 40.697, -74.001
Our plan included attaching two connected unistruts along the length of an existing wooden plank on the river side of the Pier 3 fence using stainless steel hardware that matched the installation of the beacon already installed on the same corner.
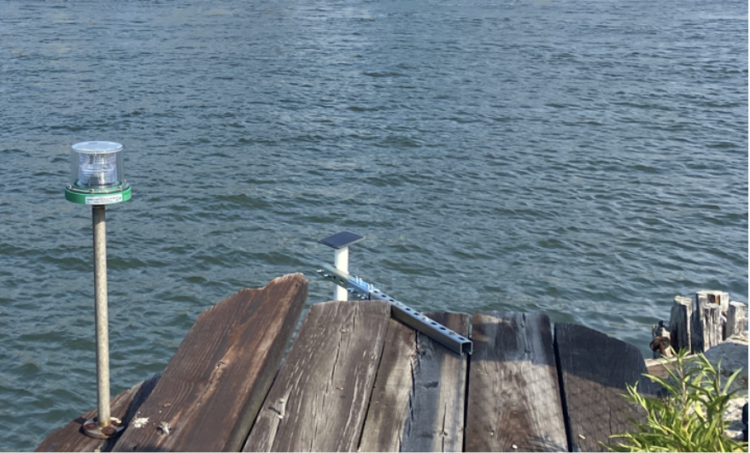
Installation next to beacon
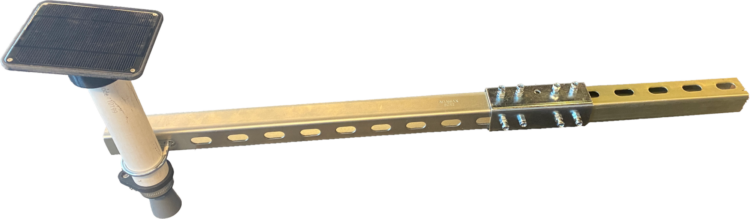
Sensor attached to Unistrut
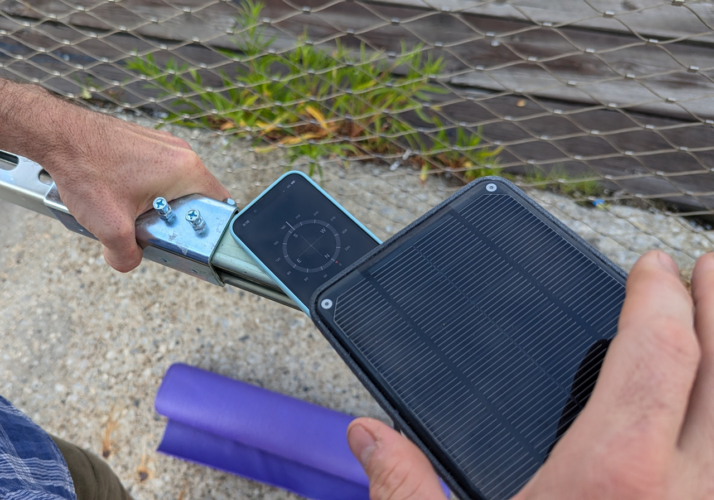
Finding south
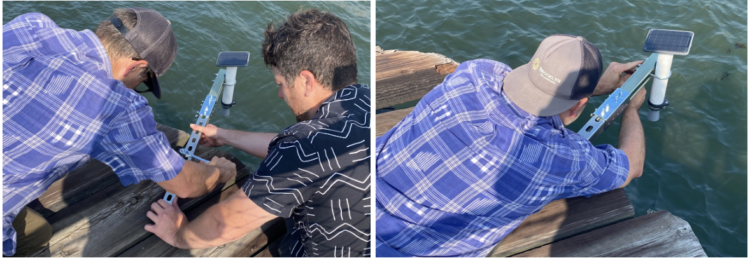
Installing gauge and tightening all bolts
The sensor comes with a built in level to ensure proper installation
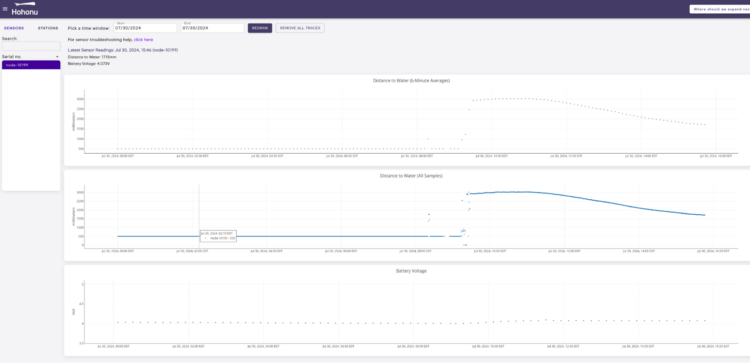
Dashboard shows sensor (including battery voltage) was working properly after installation
Within 24 hours our dashboard was live and public. For the first 35 days, only “d2w” (distance to water) measurements are available. This is the minimum amount of time needed for calculations to stabilize in translating “d2w” data to other DATUM’s such as MLLW.
Our goal with the sensor was to identify tidal high and low waters from the observed water level data and provide that data to the park and the public.
Have an application that can benefit from solar?
Leave a Reply