Knowing the electrical IV characteristics of your solar panel is critical in determining your panel’s performance in real world conditions and understanding how it will interact with your charge circuit.
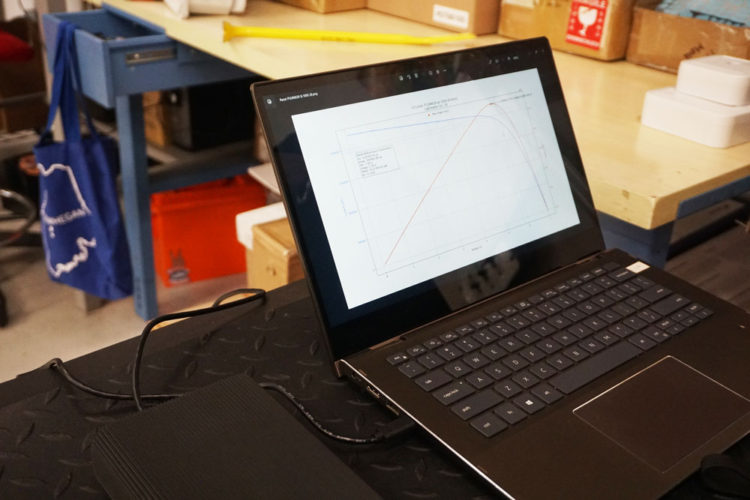
We will show you how to create IV curves using Qoitech’s Otii Ace Pro, which records currents and voltages and displays them in real time as charts and interactive measurements for analysis and comparisons. The device itself is compact and portable, highly accurate at low power, and can be powered through USB or DC.

In a previous post we showed you how to create IV curves manually and with a limited amount of equipment. While this method is inexpensive, it is also very slow.
We also generate IV curves with a Programmable DC Electronic Load, like the BK Precision 8542B. We have historically used the BK Precision 8542B with a MATLAB script that sweeps through the voltages. The downside to this approach is that the maximum resolution of this device is 0.1 mA, and we need more precision with lower power panels. The lower resolution becomes significant when we’re doing low light testing where a panel might be producing 1-10% of its full power.
Quality Control with IV Curves
We generate IV curves almost daily as part of our QC process.
For every batch of panels we receive, we go outdoors and generate IV curves for two randomly selected panels. We want to ensure the panels are, in fact, producing something close to their nominal value. We use these values to calibrate our lightbox and then run a constant voltage test indoors on our lightbox with a sample of panels.
We recently started using the Qoitech Otii to generate these IV curves. To generate close to full sun from the panel, we test between 11 and 2 during Spring and Fall. In the winter, it can be much more challenging to find a time where the sun generates close to 1,000 W/m^2 (we use a solar meter to verify the sun conditions) and is not blocked by a surrounding building.
On a recent day when we had planned to test, there was unfortunately some cloud coverage. While we rescheduled the official tests, we decided to go through with the testing exercise and use the opportunity to share our process and to train our warehouse employees on using Qoitech Otii.
Equipment for IV Curves with Qoitech
- Solar Intensity Meter, we used the TES 1333 Solar Power Meter
- Qoitech’s Otii Ace Pro with Otii Automation Toolbox
- Solar Panel
- USB-C cable
- Multimeter leads
Here’s a look at our process:
Step 1:
Download and save this python script in a folder.
Step 2:
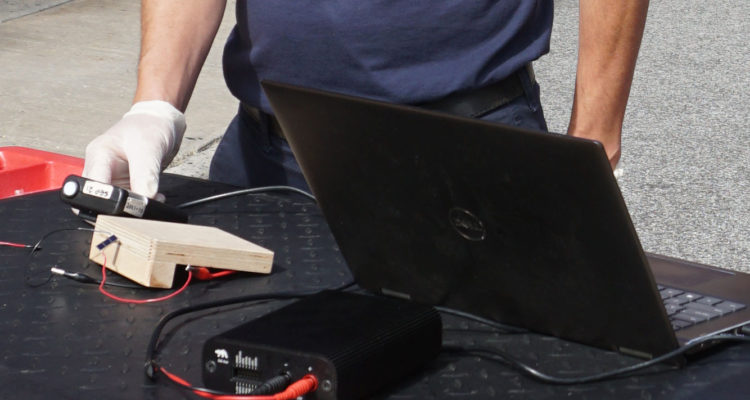
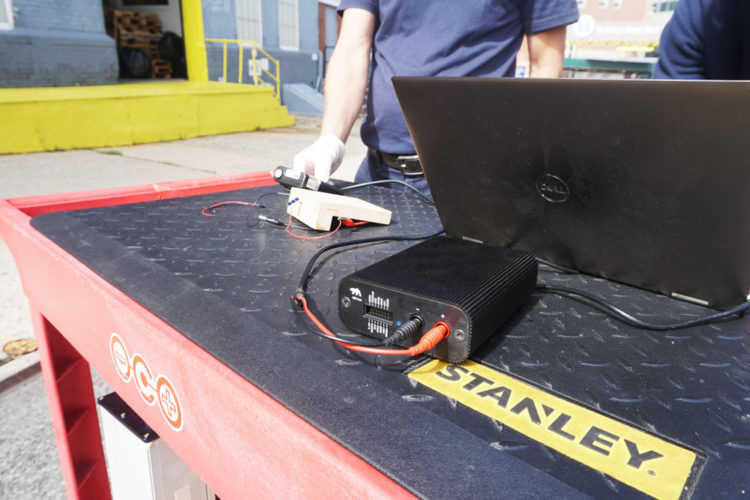
Connect the Qoitech Otii Ace Pro to a computer through USB-C:

Step 3:
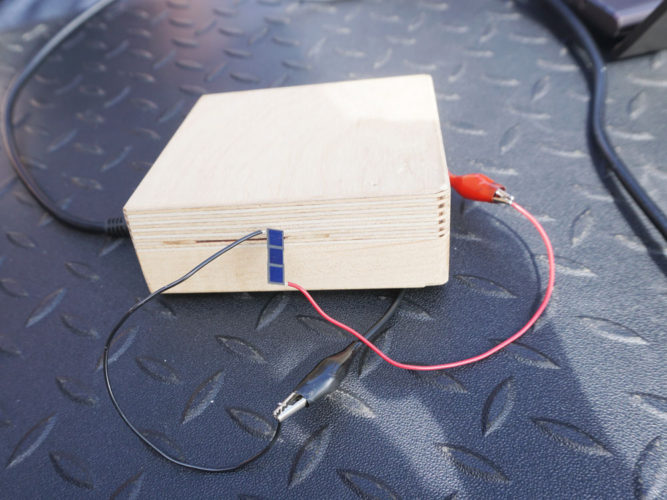
Use multimeter leads to connect the positive and negative leads to the Qoitech device. We recommend short, low gauge wires.
Connect the positive and negative leads to the solar panel. In this case, we were profiling a 18.8 x 6.2 mm solar panel with three cell pieces
Step 4:
Align the solar meter so that it faces the sun at the same angle as the panel. The solar meter measures the available solar energy measured in Watts per m^2 and allows us to assess the performance of the solar panel relative to that metric

Step 5:
On the computer, open the Command Prompt window and change directories to where the python script is stored.
Step 6:
Type the beginning of the name of the python script (IV in our case) and then press TAB to autocomplete the filename.
Step 7:
Hit ENTER to initiate the program.
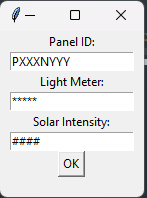
Step 8:
In the popup window that opens, we enter the panel ID, the light meter we’re using, and the solar irradiation at the time of the test, and then hit OK.
Step 9:
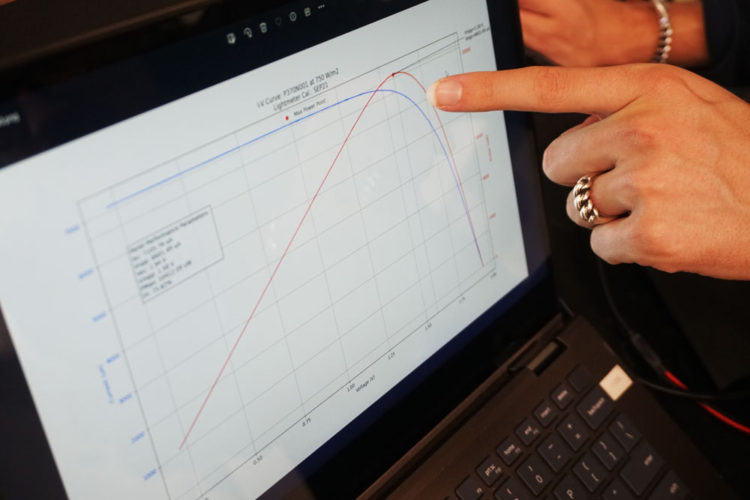
The script automatically produces the IV curve and calculates all our parameters.
- Isc – Short-circuit current
- IMPP – Current at maximum power
- Voc – Open-circuit voltage
- VMPP – Voltage at maximum power
- PMax – The maximum output power (also known as maximum power point)
- FF – Fill factor

When the program begins, the Qoitech turns on the sensors for half a second and gets the open circuit or short circuit current. It uses that value to automatically estimate the maximum current value and does a voltage sweep from zero to that max value, making constant steps along the way that record the voltage and the power values.

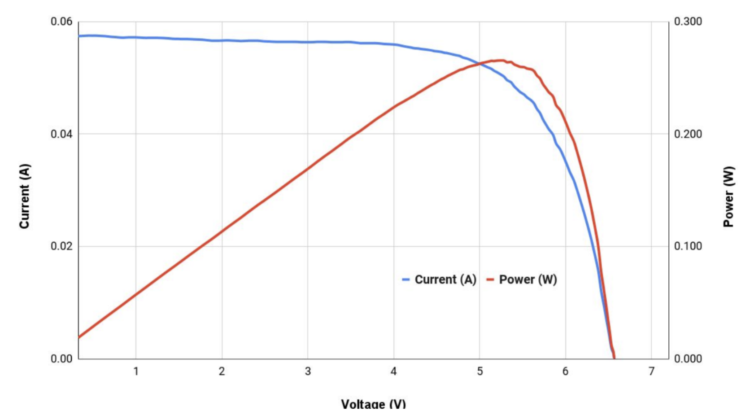
The voltage changes throughout the test based on the characteristics of the solar cell. Because of that inverse relationship between the current and the voltage, as the current increases, the voltage begins to decrease. There is a combination of current and voltage values, the point at which the product of the current and the voltage is the highest, that returns the maximum power for the panel. The power curve is actually the thing that most people are interested in, while the current curve is what is driving it.
Step 10:
If you want to run the program again, you’ll need to close the IV curve image, and back in the Command Prompt window, use the up arrow to call your last command and press ENTER to rerun the program.
If you’re interested in a particular lighting condition, like extremely low light or medium low light, you’ll want to re-characterize the panel with Qoitech in those lighting conditions by adjusting the angle of the panel or moving the panel to a shady location.
IV Curve Components and Definitions
An IV curve, or current-voltage characteristic curve, is a graphical representation of the relationship between the voltage applied across an electrical device, like a solar panel, and the current flowing through it. IV curves can help us understand how much power the panel can generate at a given light level and at what voltage. This in turn impacts the design and solar charge circuit of a device so that we capture as much energy as possible in the expected operating environment.
To create the curve, you apply a series of voltages to the solar cell while it is under illumination. The output current is measured at each voltage step, resulting in the characteristic IV curve.
An IV curve will provide the following characteristics:
- Isc – Short-circuit current
- IMPP – Current at maximum power
- Voc – Open-circuit voltage
- VMPP – Voltage at maximum power
- PMax – The maximum output power (also known as maximum power point)
- FF – Fill factor
The short-circuit current (Isc) is the current through the solar cell when the voltage across the solar cell is zero (i.e., when the solar cell is short circuited). It is the largest current which may be drawn from the solar cell. This metric is affected by:
- Solar cell’s area
- The amount of photon or light particles (received from sunlight)
- The spectrum of the light that hits the panel
- The reflection and absorption property of panel
- The probability of collection
The open-circuit voltage (Voc) is the maximum voltage available from a solar cell, and this occurs at zero current. This metric is affected by:
- The energy levels of the photoactive materials
- The work functions of the electrode materials
- The charge carrier recombination rate
At both of the operating points corresponding to Isc and Voc, the power from the solar cell is zero.
The “fill factor“ (FF) is the parameter which, in conjunction with Voc and Isc, determines the maximum power from a solar cell. The FF is defined as the ratio of the maximum power from the solar cell to the product of Voc and Isc. Graphically, the FF is a measure of the “squareness” of the solar cell and is also the area of the largest rectangle which will fit in the IV curve.
The efficiency of a solar cell is determined as the fraction of incident power which is converted to electricity and can then be calculated using the following equation:
(Isc * Voc * FF) / input
Example IV curve for a 0.3W (Nominal) 6V Panel in Full Sun
Example IV curve for a 1.2W (Nominal) 6V Panel in Full Sun

This is awesome! Thank you so much. I have been using this to test Volatic P134 R1A is various lighting and light obfuscation scenarios. I had a couple pieces of feedback that maybe you’re interested in:
1. For total newbies, it would be helpful in your tutorial to tell folks how to install numpy, matplotlib, and especially the Otii library. This was easy for me having experience, but the errors would be confusing to a total newbie.
2. The text entry prompt that pops up is blank for me. There is just the button that says “OK” with no text boxes.
3. For very low powers (e.g. the specs below), the curve seems to start at too high of a voltage. For example, this curve with Vmpp of 0.52 V starts at about 0.48V. In other words, the curve starts nearly at the very top of the “hill” of the power curve.
Isc: 242.64 UA
Impp: 230.60 uA
Voc: 0.94 V
Vmpp: 0.52 V
PMax: 119.79 uW
FF: 52.68%